AI Infrastructure Fell 9%. Tech’s Diversification Score Barely Moved.
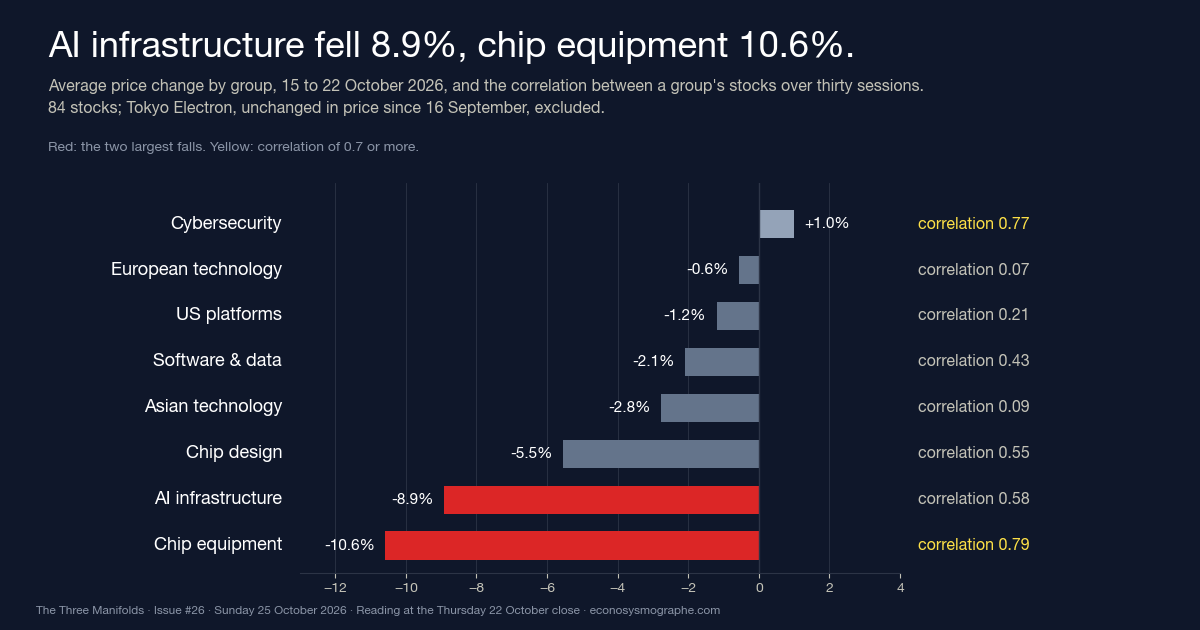
The AI-infrastructure group of our Tech panel lost 8.9% between Thursday closes and the chip-equipment group 10.6%, while Meta lost 11.9%, more than any group, and the ten-year Treasury yield closed Thursday at 4.96%. The panel’s diversification score read 54.6% against 54.9% a week earlier. It describes how the sector’s correlations are shared out, not the size of a loss, and the sector’s common direction read outside its usual range for the third time in seven sessions.
The Three Manifolds · Issue #26 · Technology issue · Sunday 25 October 2026 · Manifold data as of Thursday 22 October 2026 close · Market data through Friday 23 October · 10 min read
The reading in 30 seconds
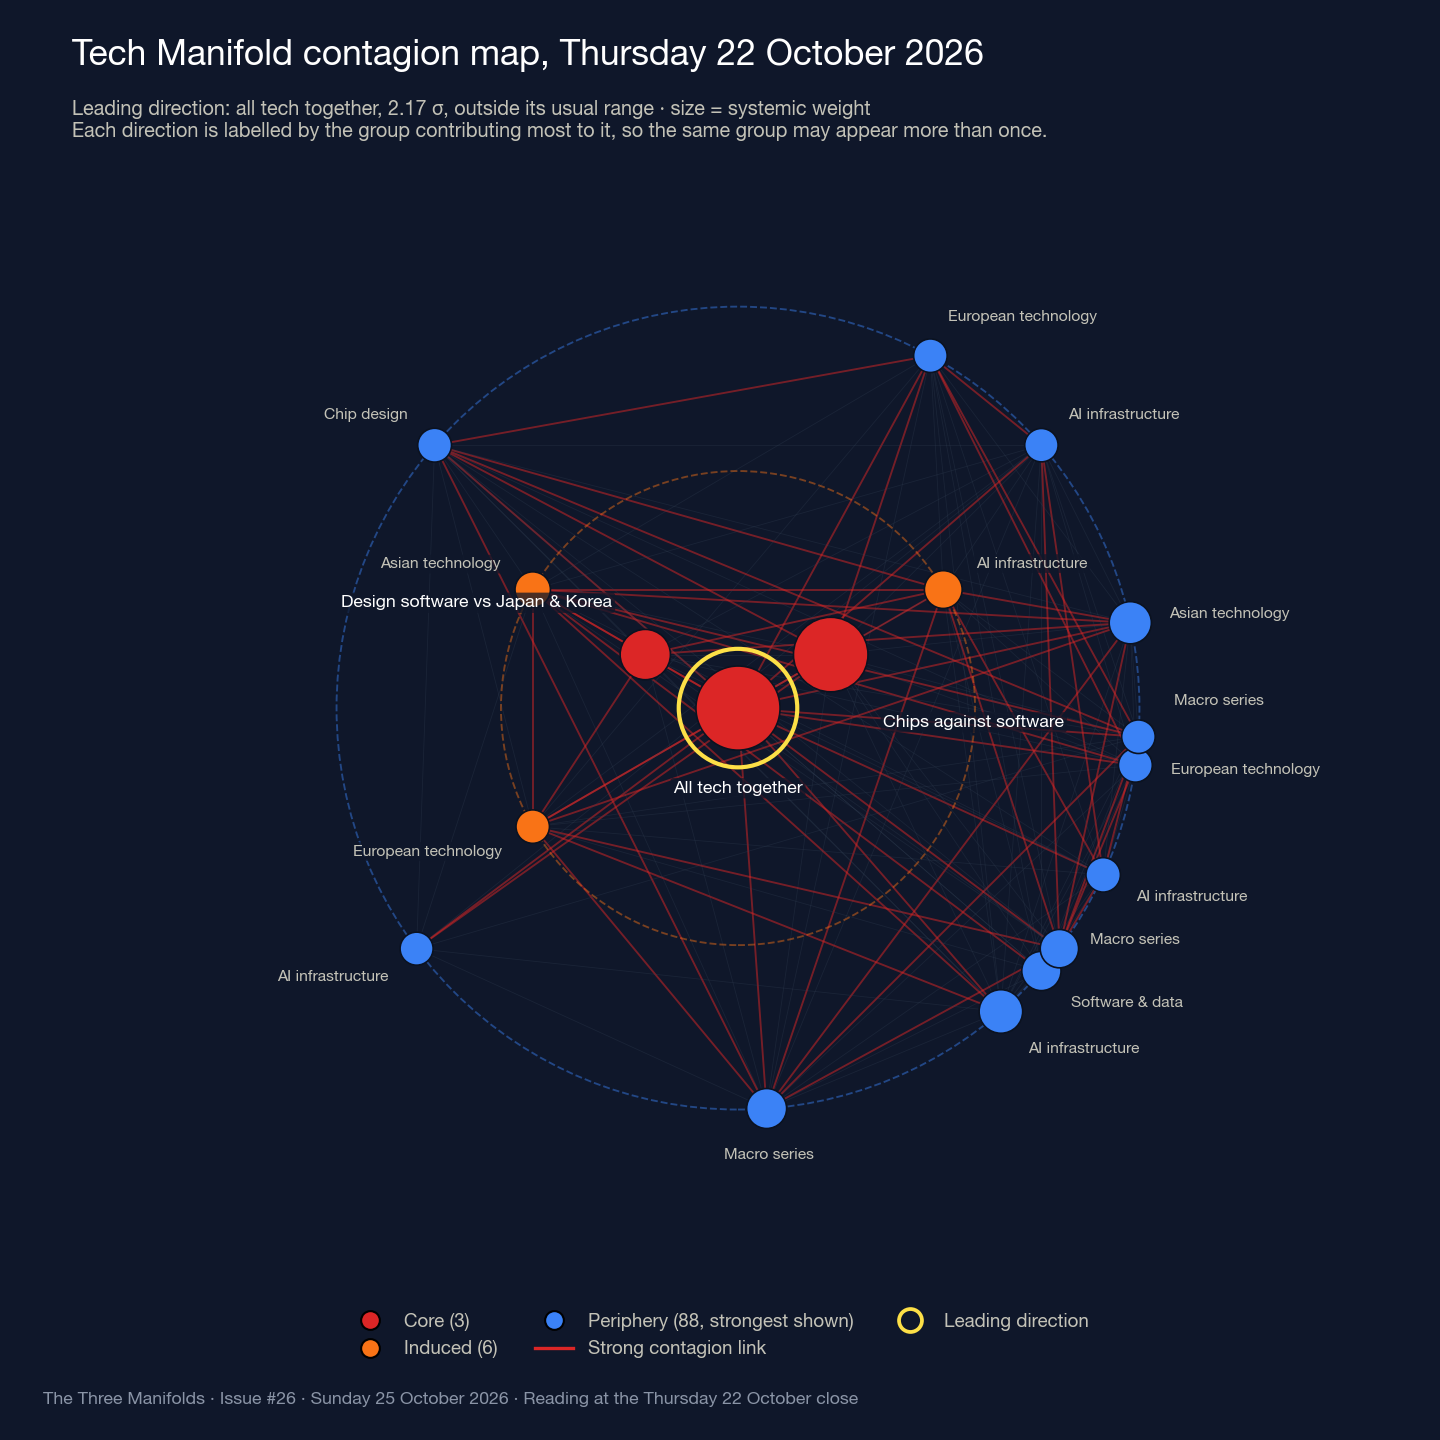
Three readings. The losses sat with the suppliers: AI infrastructure lost 8.9% and chip equipment 10.6% between Thursdays, while the thirteen US platforms lost 1.2% on average even as Meta, Alphabet and Oracle lost 7% to 12%. The sector’s diversification score fell 0.3 point to 54.6%, flat under our one-point rule: it describes how the sector’s correlations are shared out, not how much anyone lost. And the sector’s common direction, the component to which all 84 stocks contribute with the same sign, read outside its usual range on Thursday for the third time in seven sessions, while the platforms and the AI-infrastructure group, nearly uncorrelated a month ago at 0.02, correlated at 0.44.
The week
Our diagnostics stop at Thursday’s close, and Friday’s closes below are quoted for context. On the Treasury’s daily par curve the ten-year yield fell 17 basis points on Thursday, from 5.13% to 4.96%, the largest one-day fall of 2026 and the first close below 5% since 22 September, and closed Friday at 5.00%. The ICE BofA US high-yield spread rose 17 basis points between Thursdays to 3.40% and the Nasdaq Composite fell 2.6% on Thursday to 26,008.86, both on FRED. Meta reported after Wednesday’s close revenue up 26% to $64.60 billion, capital expenditures of $34.91 billion and free cash flow of minus $2.12 billion, the company said. In our panel’s price index Meta fell 11.9% between Thursdays, Alphabet 7.2%, Oracle 6.6%, Lam Research 17.1% and CoreWeave 20.2%. Oracle filed no current report with the SEC in October, its last Form 8-K dating from 14 September.
New York: the day’s stress on gold, Technology and Staples
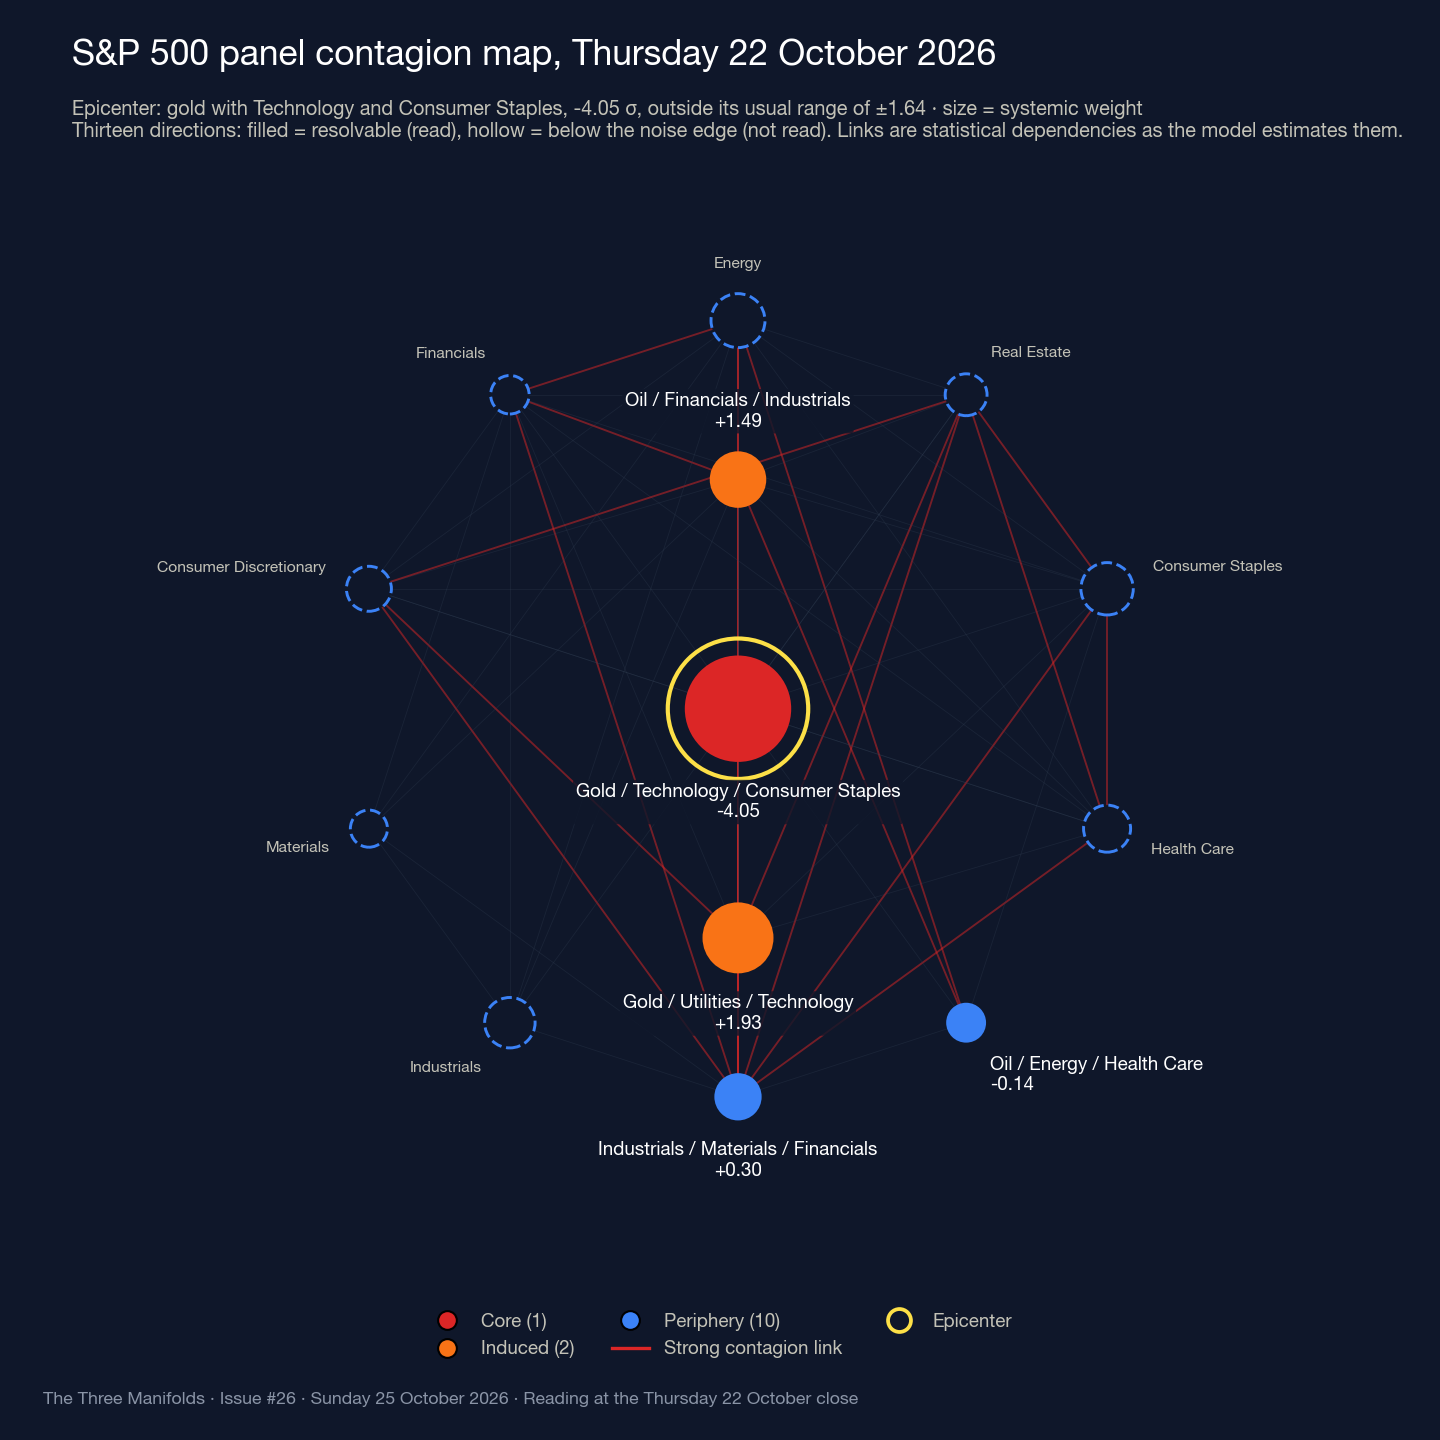
Our panel of eleven S&P 500 sectors, oil and gold read 70.2% on Thursday, up from 69.5% a week earlier and its highest since 11 March. The direction tying gold to Technology and Consumer Staples, which had read minus 2.76 on 14 October and 0.91 on 15 October, read minus 4.05, outside its usual range of plus or minus 1.64 and classified by the model as transmitting stress: an epicenter. Gold fell 3.6% between Thursdays in our panel’s price index.
Europe and the composite
The European panel read 56.5% in Thursday’s run and 55.7% in Friday’s, provisional, and we do not quote its lead. The composite of 89 assets read 27.7% in Thursday’s run and 27.4% in Friday’s, provisional, and its Treasury direction read 1.51 on Thursday, inside its range, in a week when the ten-year fell 14 basis points.
Under the panels
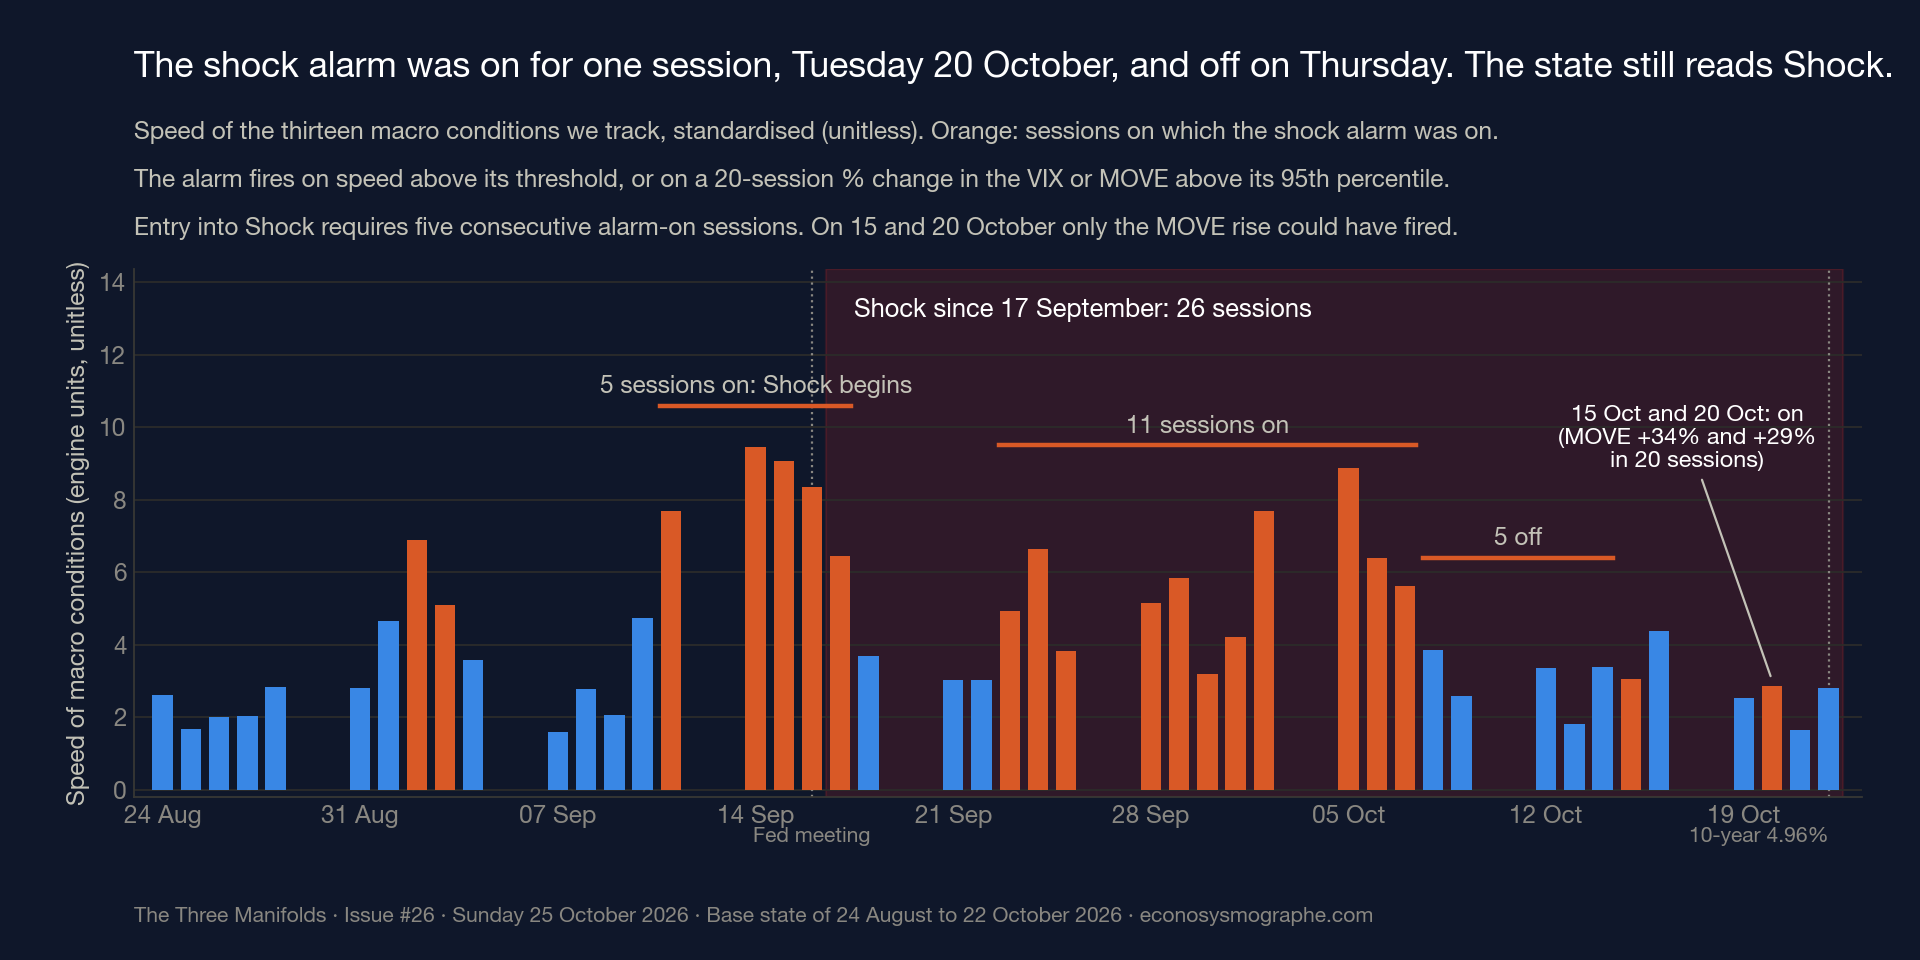
The business cycle still reads Expansion on the OECD’s leading indicator, and the fast layer of our macro state has read Shock since 17 September, twenty-six sessions. The shock alarm, through which the state is entered, switched on for one session, Tuesday 20 October, on the Treasury-volatility leg: the ICE BofA MOVE index closed that day at 101.70, 29.5% above its 78.56 of 22 September, a rise larger than any observed with the alarm off in the model’s available history. On Thursday the alarm was off.
Technology: the losses sat with the suppliers, the score with the sector
The Tech Manifold follows 85 technology stocks in eight groups with thirteen macro series. Thursday’s run retained 84: Tokyo Electron’s price series has shown no change since 16 September and is excluded from the figures below as suspect, pending confirmation of the feed. On 17 October one macro series was removed as a duplicate and the history recomputed, so Thursday’s 54.6% compares with 54.9% on 15 October and 55.4% on 24 September on that history, not with the “around 52%” Issue #25 quoted on the earlier composition.
| Group | Stocks | Price change, 15 → 22 Oct | Price change, 24 Sept → 22 Oct | Correlation between members, 30 sessions, 22 Oct (24 Sept) |
|---|---|---|---|---|
| Chip equipment | 8 | −10.6% | −17.7% | 0.79 (0.79) |
| AI infrastructure | 9 | −8.9% | −18.5% | 0.58 (0.50) |
| Chip design | 14 | −5.5% | −9.9% | 0.55 (0.45) |
| Asian technology | 11 | −2.8% | −7.2% | 0.09 (0.09) |
| Software & data | 10 | −2.1% | 0.0% | 0.43 (0.40) |
| US platforms | 13 | −1.2% | +0.9% | 0.21 (0.26) |
| European technology | 10 | −0.6% | +2.7% | 0.07 (0.10) |
| Cybersecurity | 9 | +1.0% | +1.4% | 0.77 (0.76) |
84 stocks, Tokyo Electron excluded. Returns are equal-weighted averages of each stock’s return between the two closes. Correlations are averages of pairwise correlations of daily returns within each group.
Inside the groups, the equipment makers were already the most tightly bound, at 0.79, and stayed so, while the AI-infrastructure names drew closer, to 0.58 from 0.50. Between groups, the thirty-session correlation of average daily returns between the platforms and the AI-infrastructure group read 0.44 to Thursday against 0.02 to 24 September, and between the five platforms Meta, Alphabet, Amazon, Microsoft and Oracle and that group 0.71 against 0.39. Those are group-level linear correlations over one window, and they say nothing about any one supplier’s dependence on any one platform.
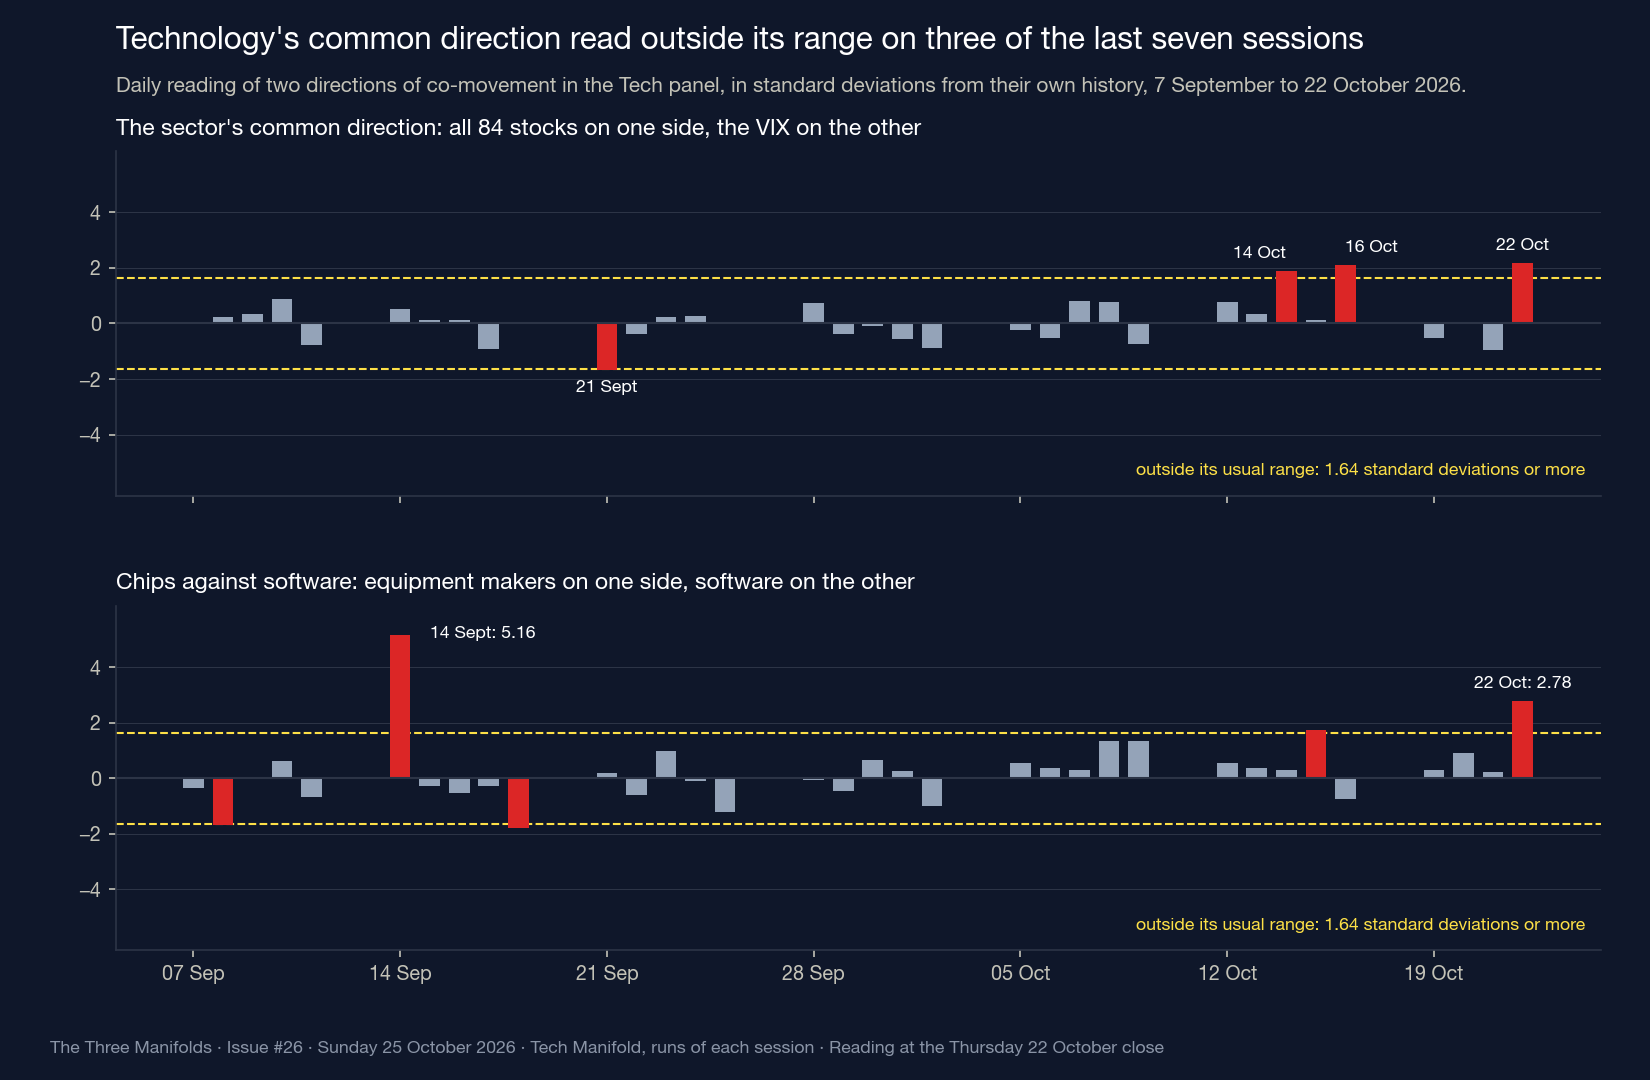
The panel’s common direction, the component to which all 84 stocks contribute with the same sign and the VIX with the opposite one, closely matches, when restricted to the stocks, the first direction of the 84-stock block. That stock-only direction explains 27.5% of the stocks’ joint variance, against 27.6% on 24 September. The panel direction’s composition on Thursday matched that of 24 September, with an overlap of 0.9999. What changed is its reading: 1.90 on 14 October, 2.11 on 16 October and 2.17 on Thursday, outside its usual range of plus or minus 1.64 all three times and once before since 7 September. The second direction, chip equipment against software, read 2.78 on Thursday, also outside that range, as three software companies rose and the equipment makers fell.
The audit: last Sunday’s five checks
- Macro, Shock or not: held. Shock on every session from 16 to 22 October, the alarm on for one session, Tuesday, and off on Thursday.
- New York, floor at 66 and a session at 70: held and reached, never below 66% and 70.2% on Thursday.
- New York, any direction at 1.64 in absolute value: yes, on 16, 19 and 22 October, at 1.82, minus 1.76 and minus 4.05.
- Treasuries at 1.64 in absolute value on any session: no, 1.51 at most, on Thursday.
- Technology, three parts. The SK Hynix, Samsung and Tencent direction on Thursday: not assessable under its original definition, as the direction no longer exists and no correspondence to a successor is established. The CoreWeave, Synopsys and SK Hynix direction over the week: partial, inside its range on 16 October, the one session it existed, with no continuity established after that. As a separate observation, the direction that has carried CoreWeave since 19 October, with Nintendo and Samsung, read 1.67 on Thursday, outside its range. The lockstep count: not produced, last read nine of nine on 13 October. The Tech checks are read on the panel as it stood each day, before and after the 17 October change.
For an allocator
What follows is diagnostic and not prescriptive. For a family office, the question is how much of its technology exposure, once the economic exposures held several times through funds and ETFs are aggregated, sits on the sector’s common direction, where our panel read the stress, rather than on three names. For a treasurer whose placements carry such lines, it is how a move along the chips-against-software direction, which read 2.78 on Thursday, would bear on their sensitivity, on the risk limits and on the liquidity needs they are held against. For a quantitative analyst, it is whether the group-level correlations, 0.02 to 0.44 in a month, survive the exclusion of a suspect series and the recomputed history.
Apply this reading to your own positions and weights →
Before Issue #27
Issue #27 reads Thursday 29 October. Five checks on the sessions from Monday 26 to Thursday 29 October, each with its reference reading of 22 October. Friday 23 October is already in our files and is left out.
- Macro: whether the fast layer has left Shock on any session, and whether the alarm is on or off on Thursday 29 October. Reference: Shock, alarm off.
- New York: below 66.0 on any session, and 70.0 or above on Thursday 29 October. Reference: 70.2 on the diversification score.
- New York directions: the gold, Technology and Staples direction at 1.64 or more in absolute value on Thursday 29 October, and any resolvable direction on any session. Reference: minus 4.05.
- Treasuries: the composite’s Treasury direction at 1.64 or more in absolute value on any session, in runs that receive the Treasury closes a day late. Reference: 1.51.
- Technology: the common direction at 1.64 or more in absolute value on any session, the chips-against-software direction on Thursday 29 October, and the five platforms’ correlation with the AI-infrastructure group above 0.60, a level that would keep most of the month’s rise from 0.39 to 0.71. Reference: 2.17, 2.78 and 0.71.
The Federal Open Market Committee meets on 27 and 28 October and the European Central Bank’s Governing Council on 28 and 29 October, according to their calendars. Microsoft reports on Wednesday 28 October and Amazon on Thursday 29 October, according to their investor sites. Alphabet had posted no date on its investor site when we read it on Sunday morning.
- The platform → econosysmographe.com/platform · Methodology → econosysmographe.com/methodology · Glossary → econosysmographe.com/glossary · contact@econosysmographe.eu
Notation annex → The measures are experimental research metrics from the Universal Risk Framework (SSRN working papers), not market standards. The diversification score is the TSS: how evenly the panel’s correlation structure is distributed across directions of co-movement (100% = evenly spread; low = concentrated); all diversification percentages quoted in this article are TSS*, the score as a share of the ceiling a panel of that size can reach, and a weekly change under one point is called flat. The score is computed on the panel’s series, equal-weighted, and measures neither the size of any loss nor the risk of any particular portfolio. A direction is an eigenvector of the panel’s correlation structure (97 series on Thursday), estimated on the history since July 2024; the daily readings are taken on these panel directions. The common direction is the first of them: all 84 stocks enter it with the same sign and the VIX with the opposite one, which does not mean they move the same way each day (on the median day of the last thirty sessions 68% of them closed on the same side, 76% on Thursday). The share of the stocks’ joint variance, 27.5%, is the first eigenvalue of the 84-stock block of that correlation structure over the block’s trace; the first direction of the block and the panel’s common direction restricted to the stocks coincide to four decimals. The overlap of a direction between two dates is the absolute cosine of its loading vectors, from the two dates’ separate estimations, on the 97 series common to both: 0.9999 for the common direction and 0.9996 for the second, chip equipment against software, between 24 September and 22 October; a month adds little to a history of more than two years. A direction is resolvable when its eigenvalue lies above the noise edge of a random matrix of the same shape, and only resolvable directions are read. Each resolvable direction is read over thirty sessions, in standard deviations from its own history; the leading direction is, among those the model classifies as transmitting stress, the one whose reading is the most unusual, and it is named an epicenter only when the absolute value of that reading is at least 1.64. Transmitting and absorbing are the model’s classifications, not demonstrated transmission. Core / induced / periphery rank every direction of the panel. A panel is provisional when some of its series are carried forward from the previous session; it is then quoted with the value of the next day’s run beside the day’s. Group price changes are equal-weighted averages of each stock’s return between two closes; correlations within a group are averages of pairwise correlations of daily returns over thirty sessions, and between groups the linear correlation of the two groups’ average daily returns over the same window; a series without a price change over five sessions is flagged as suspect and excluded from these group figures pending confirmation. Lockstep, not produced this week, is a stock’s curvature reading against the 90th percentile of its own past. The macro state has two layers: a slow one, the business-cycle phase read from the OECD composite leading indicator, and a fast one that sorts thirteen macro conditions into named regimes; the Shock state is entered after five consecutive sessions on which the shock alarm is on and persists as a classification, and the alarm is on when the speed of those conditions exceeds its threshold, whatever their direction, or when the twenty-session percentage change in the VIX or in the MOVE index exceeds its own 95th percentile. Readings are taken on the last settled session, Thursday; Friday’s session is read in Tuesday’s brief. Full methodology at econosysmographe.com/methodology.
Sources. U.S. Treasury, Daily Treasury Par Yield Curve Rates, 15 to 23 October 2026, and the 2026 file. Federal Reserve, FOMC meeting calendar for 2026. FRED: NASDAQCOM, DGS10, VIXCLS, BAMLH0A0HYM2 (ICE BofA US high-yield OAS), closes of 15 to 23 October 2026. ICE BofA MOVE index closes. Cboe: VIX closes. Meta Platforms, Inc., “Meta Reports Third Quarter 2026 Results”, 21 October 2026, SEC EDGAR. Lam Research Corporation, results for the quarter ended 27 September 2026, 21 October 2026. Oracle Corporation, Form 8-K filings index, SEC EDGAR, read 24 October 2026. Microsoft Corporation and Amazon.com, Inc., investor-relations event pages for their quarterly results of 28 and 29 October 2026; Alphabet Inc., investor site, read 25 October 2026. European Central Bank, Governing Council calendar for 2026. Exchange closing prices (Nasdaq, NYSE, Nasdaq Helsinki, Euronext Amsterdam, Korea Exchange, Hong Kong, Tokyo) of the stocks of the Tech panel, 24 September to 22 October 2026. OECD, Composite Leading Indicator. Econosysmographe: Tech Manifold panel (98 series, 97 in Thursday’s run) and its group hierarchy, S&P 500 SPD(13), STOXX 600 sector panel, Global Systemic Composite SPD(89), Base V3. Manifold data as of Thursday 22 October 2026 close. Raw payloads on request.
Disclaimer & Regulatory Status. This document is published for sophisticated, professional, and institutional readers for informational and educational purposes only. It does not constitute investment research within the meaning of regulatory frameworks, nor is it an offer, solicitation, or recommendation to buy or sell any financial instrument. SmartGreenInvest Ltd (Reg. England & Wales No. 14636473) is not an FCA-regulated firm. All analyses are based on public quantitative data and geometric modeling as of the date of publication. Opinions expressed are subject to change without notice. Historical performance and model readings are not indicative of future results. SmartGreenInvest Ltd holds no positions in the issuers named. The author is a self-directed, long-term buy-and-hold investor in US technology equities, at a scale immaterial to the market capitalisations discussed.
By Evangelos Papadopoulos · Independent Researcher · econosysmographe.com