$68 Billion on IBM, $1 Trillion on SpaceX — The Configuration Was on the Tape Since Mid-June
IBM erased $68 billion in one session on 14 July. SpaceX has erased approximately $1 trillion in paper market capitalisation since its 16 June intraday peak. Advanced correlation signals across Consumer Discretionary (XLY), Tech (XLK) and Real Estate (XLRE) already flagged the fragility in mid-June — when the tape was still buying the story.
Three Manifolds · Weekly Market Reading · Issue #12 · Sunday 19 July 2026 · Reading as of Friday 17 July 2026 close · 5 min read
If your book carries the growth and rate-sensitive complex — XLK, XLY, XLRE, and the June IPO cohort with SpaceX inside it — your hedge is on the wrong leg. The S&P manifold showed this exact emission triplet six weeks ago, in mid-June, when the market was still reading it as noise. This week it came back, in the same configuration, in the same session as the tape finally consolidated the story.
Monday. SK Hynix fell 15% in Asia, its largest single-day drop on record, and the KOSPI tripped a 20-minute circuit breaker as HBM4 shipments came in short. Tuesday. IBM erased $68 billion in market capitalisation in one session — its worst single day since October 1987 — after Arvind Krishna admitted a late-June client capex shift out of software and into supply-constrained memory and storage. Wednesday. SpaceX crossed under its own $135 June IPO price for the first time, 42% below its own $225.60 post-debut peak. Roughly $1 trillion in paper market capitalisation has been wiped since the 16 June intraday peak — but the structural point is elsewhere. This week’s price is anchored on a 4.2% public float (555 million shares of a 13.08 billion total). The remaining 95.8% sits behind a staggered lock-up: first tranche eligible at Q2 earnings (late July–August 2026), full 180-day expiry on 8 December 2026, and Musk’s 6.4 billion shares unlock on 12 June 2027 with no early-release provision. The strategic play behind this pricing dynamic is transparent: S&P 500 inclusion would trigger roughly $60 billion in passive index-fund buying that could absorb the lock-up supply shocks, as Tesla’s December 2020 inclusion demonstrated. The mechanical obstacle is that S&P 500 eligibility requires a public float of at least 50% — SpaceX’s 4.2% is twelve times below the threshold, and cannot mathematically reach it before Musk’s 12 June 2027 unlock. The multiple supporting the current valuation — roughly 130× price-to-sales as of mid-July 2026, some three to four times Nvidia’s own multiple and more than fifteen times Apple’s — is not anchored to a comparable earnings or cash-flow footing. Friday close. The S&P finished at 7,458, down 1.5% for the week; the Nasdaq at −2.9%; Morgan Stanley and Goldman Sachs each down more than three percent despite earnings that beat consensus.
The consensus reads this as sector rotation with an idiosyncratic memory-chip catalyst. The manifold reads it as one event with several moving parts, and it recognises the shape. Microsoft, Amazon and Alphabet — the three US cloud majors — will together spend roughly $570 billion on AI infrastructure in 2026, up sharply from 2025, with Microsoft alone guiding to $190 billion. This week the tape delivered its answer to that commitment: investors want ROI, not more capex promises. IBM was the first standalone software vendor to confess that corporate IT budgets are being reallocated into the cloud infrastructure buildout and its memory suppliers, and out of the traditional enterprise-software layer. SpaceX crossing under its IPO signalled the same doubt at the frontier-tech end of the growth trade. The S&P manifold’s emission root — XLY, XLK, XLRE — is the same triplet that emerged in Issues #6 through #9 in June, disappeared during the Energy (Issue #10) and Materials (Issue #11) rotations of early July, and returned in full this week. What has changed is not the pattern. What has changed is that the humans on the tape are now naming it.
Three numbers for Monday’s book review:
- IBM −25% on 14 July — $68 billion market capitalisation erased in one session. First large-scale, quantifiable confession that corporate IT budgets are reallocating.
- SpaceX $131.11 close vs $135 IPO — the largest stock debut in history trading below its own issue price six weeks post-debut.
- US 3-month bill σ 94% — seventh consecutive week widening, past the 94% mark for the first time. Where the equity outflow went: the Macro manifold’s emission root — IEF, US 10-year real yield, breakeven — has not moved for three consecutive Issues.
Below, the anatomy. But the operational point stands in a sentence: the manifold showed this configuration six weeks ago, released it, and returned to it this week — precisely as the humans on the tape started asking the ROI question in earnest.
Apply for Institutional Access — 20 spots, institutional only →
On the FCI, TSS, σ and epicenter notation → TSS is the Topological Stress Score, an intra-manifold measure of how far the joint sector-covariance structure has moved from its geometric equilibrium — a single scalar summarising the dispersion of the whole panel. Zones — Calm, Elevated, Tension, Singularity — carry the qualitative reading. FCI is the Financial Conditions Index, a 0–1 aggregate of macro-financial tightness that peaks near 0.9 in stressed regimes and eases toward 0.5 in accommodative ones. σ is the Two-Prices dispersion score: how far a single asset’s spot price sits from its geometric-equilibrium (geodesic) price on the curved manifold of correlation matrices, expressed as a percentage. The geodesic price is the value an asset would carry if it were perfectly aligned with the historical risk-premium structure of its cross-asset peers — an implied structural anchor derived from the joint dispersion of the panel, not a forecast or target. Higher σ = wider structural gap; ~90% is the manifold’s empirical ceiling. The regime label — rupture (stretched above geodesic), suture (compressed toward or below it), compression (a distinct third regime, more extreme than standard suture) — characterises the geometric state. Contagion zones describe a node’s topological position in the joint dispersion structure: CORE absorbs the most contagion-mediated stress and typically emits along the network’s transmission paths; induced carries directional emission along those paths; periphery sits at the structure’s edge. The epicenter is the node with the highest emission systemic norm across the network, regardless of its zone. σ (width), zone (topology), and epicenter (systemic norm) are three distinct measurements on the same manifold — the three-way triangulation of financial stress that no other published framework surfaces. Full methodology at econosysmographe.com/methodology.
Two hedges to re-cost before Monday nine → (1) Growth-rates complex (XLK/XLY/XLRE). The S&P manifold’s emission root has returned to this triplet, the same configuration it recorded in June. If the XLK exposure is hedged against XLE (Issue #10’s CORE) or XLB (Issue #11’s), the hedge is on the wrong leg. Re-cost against a duration or breakeven leg. (2) T-bill correlation. The three-month bill remains an attractive yield instrument — 4-5% annualised — but at σ 94% it has stopped absorbing portfolio variance and now moves *with* the panel. If the VaR model treats T-bills as riskless residual, the model is at least one Issue behind. Keep the T-bill for yield; do not count on it as diversifier. Full four-point re-costing in the allocator section below.
What the tape said. What the manifold read.
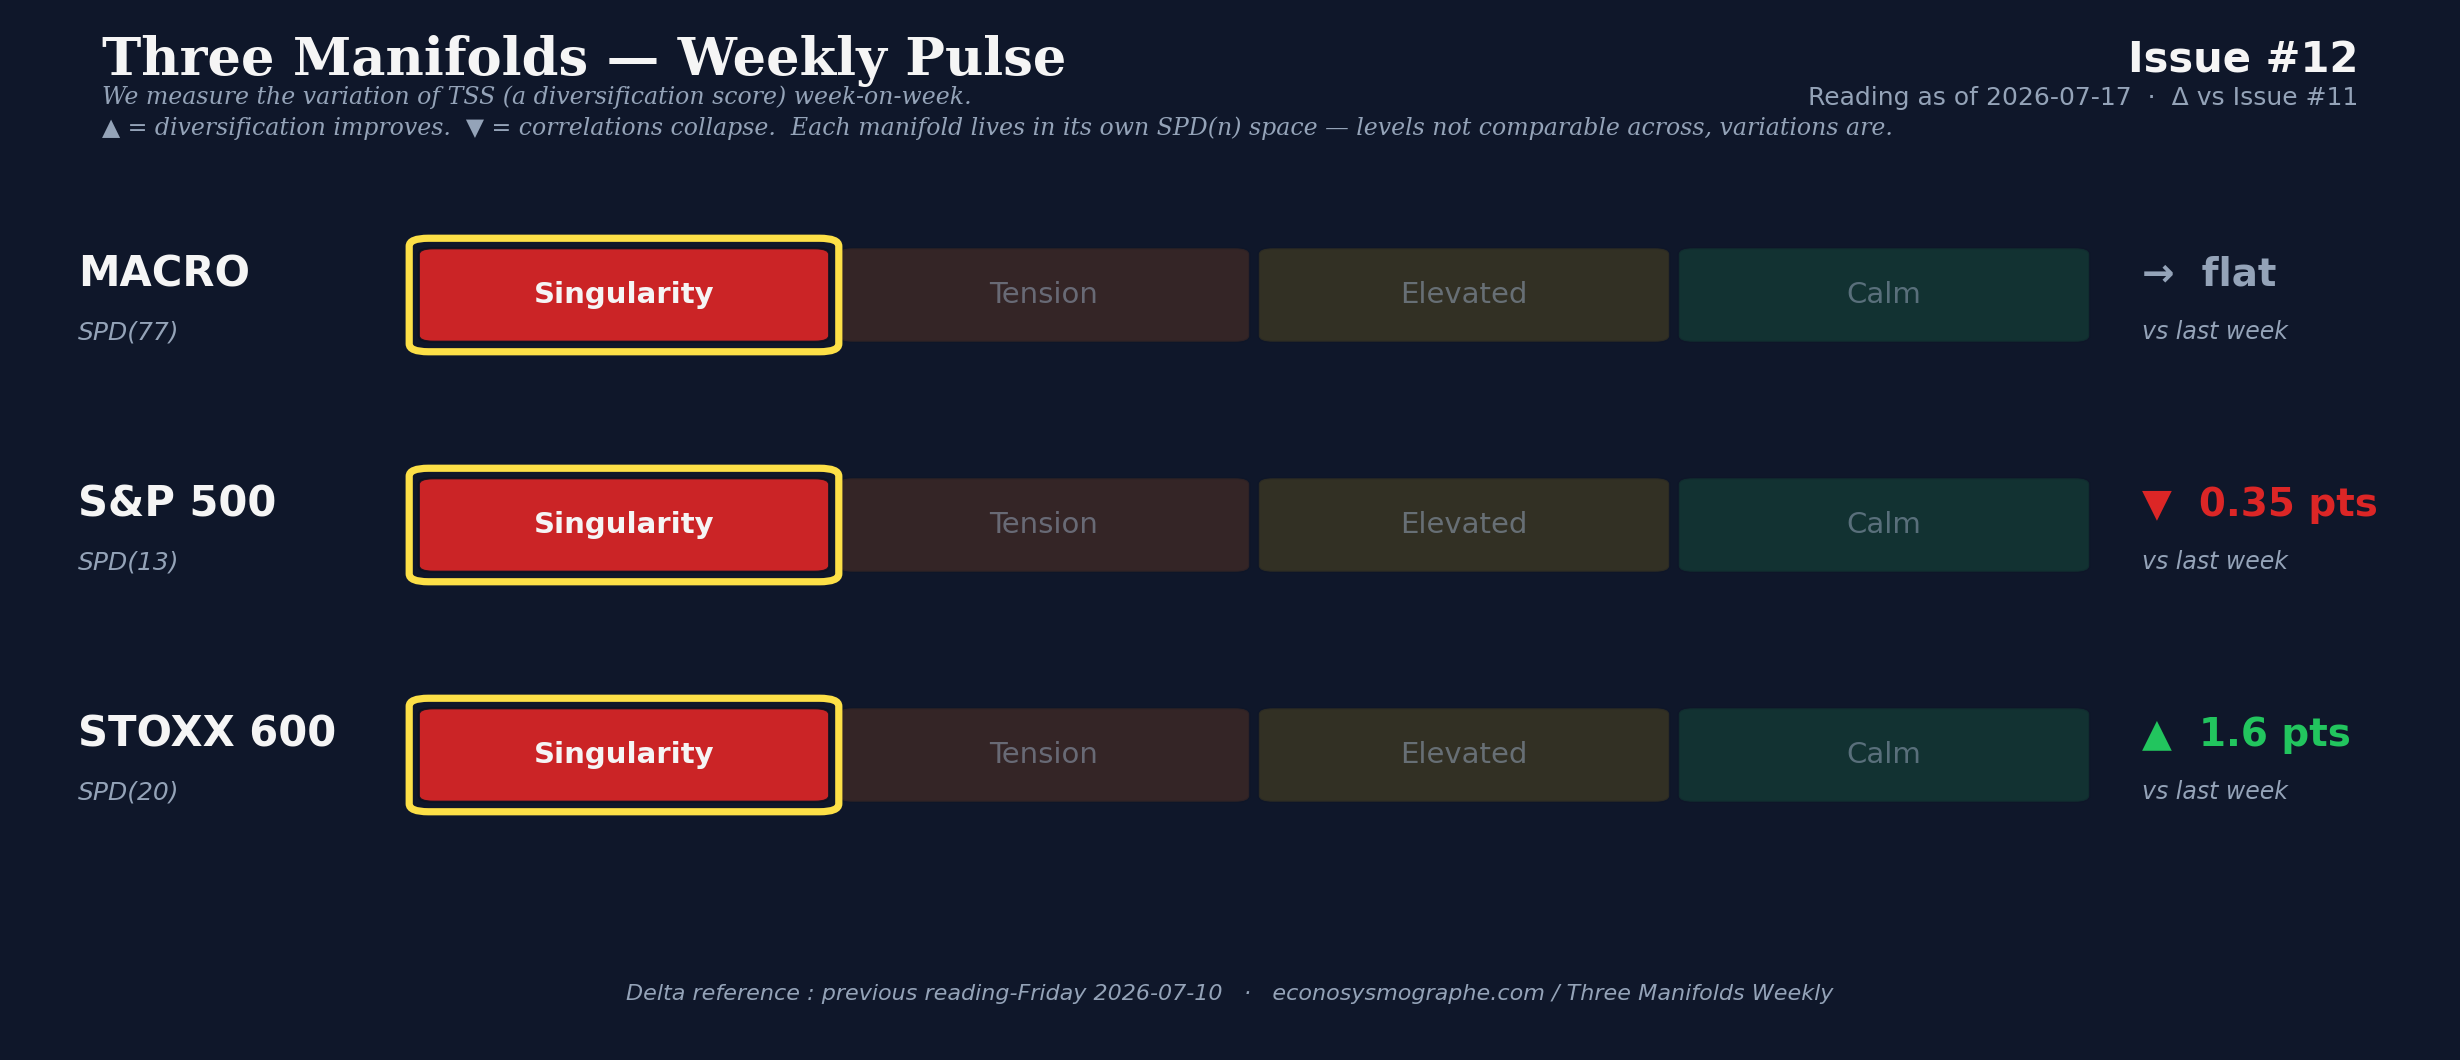
The Macro 77-node panel is still emitting from the Treasury duration complex — IEF, the 10-year real yield, and the 10-year breakeven — for the third consecutive Issue. TSS 0.4% Singularity (▲ +0.01 vs Issue #11 — flat). FCI 0.60 Moderate (flat, but this reading follows a June peak of 0.90 in Issue #8 — the tightest macro-financial condition of the current series, near the historical 0.9 threshold). Velocity slow_reversion. Widest: US_3M_Bill σ 94% above geodesic +156%, seventh consecutive weekly climb. The pattern the contagion topology exposes here is the one no aggregate reads: the Treasury complex absorbs the equity outflow without moving its emission root, so the FCI aggregate mutes what the σ and epicenter surface together — capital rotating into duration while headline conditions ease. The June CPI printed hot on Tuesday, the Fed’s 8 July minutes came out hawkish, fresh Middle East strikes weighed on Monday — yet the ten-year finished the week at 4.55%, essentially flat from Issue #11’s 4.57%. The Treasury complex absorbed the volatility and the safe-haven bid; the yield stayed flat because supply and demand met in the middle of the same storm. This is where the capital that left the tech and IPO complex went, and the manifold has been priced for that flow since Issue #10.
The S&P 13-node manifold sat at TSS 49.5% Singularity (borderline, ▼ −0.4 vs Issue #11), FCI 0.45 Calm (▲ +0.02), velocity slow_reversion. Widest: XLC Communication Services σ 35%, tracking the Netflix earnings pressure and the tech-adjacent complex under strain. Two-Prices regime: 11 rupture, 0 suture — every one of the eleven S&P sectors trades above its own geodesic anchor. Emission root: XLY (Consumer Discretionary) · XLK (Information Technology) · XLRE (Real Estate). This triplet is not new to the series. It emerged as the top-3 emission cluster in June — Issues #6 (XLC/XLK/XLRE), #8 (XLRE/XLK/XLC), and #9 (XLY/XLK/XLRE) — while a macro FCI of 0.87–0.90 was signalling the tightest financial conditions of the current series. It then dissolved in early July as the emission root rotated into Energy (XLE, Issue #10) and Materials (XLB, Issue #11), commodity- and cycle-linked rotations tracking Middle East strikes and the June FOMC hawkish shift. This week the same triplet reappears — XLY, XLK, XLRE — five sessions after IBM’s confession, three sessions after SpaceX crossed its IPO, and one session after the bank majors sold on beat. The manifold recognises the shape it recorded in June. The tape spent the intervening five weeks confirming why it belonged there.
The STOXX 600 widened 1.6 TSS points to 38.3% Singularity — the largest single-week widening of the panel in the current series — with velocity slow_escape (positive acceleration, continuing outward). Widest: STOXX600_Utilities σ 51% above geodesic +67%, the widest single-sector reading of the STOXX panel in the current series. The contagion pattern here is the one that no other published framework surfaces: European defensives leading the widening (Utilities widest, Health/Food&Bev/Retail at emission root) while the FCI eases — the topology captures a flight-from-shelter that the aggregate financial-conditions read cannot represent. Emission root rotated in one week: from Banks (Issue #11, the offensive European trade) to Health · Food & Beverages · Retail — the defensive complex, now the source of the widening rather than its shelter. When defensives lead the widening — as opposed to absorbing it as they classically do — the flight is being priced from within the shelter itself. European risk architecture without a bid outside its own defensive complex.
The two frames diverged on the same seven-day tape. The S&P manifold compressed 0.35 TSS points with slow_reversion velocity — the American manifold read the sell-off as tension release. The STOXX manifold widened 1.61 TSS points with slow_escape velocity — the European manifold read the same news as continuing widening. Nowhere in the last ten Issues have the S&P and STOXX manifolds diverged this cleanly on the same week. The Macro manifold flat, its emission root unchanged for three Issues, is the arbiter.
Book the geometric reading on your own multi-asset book →

S&P 500 — 11-sector two-prices ranking
| SPDR sector | σ (%) | Regime | Transmission vector / role |
|---|---|---|---|
| XLC Communication Services | 35.3 | rupture | Widest (Netflix earnings pressure; recurrent widest since Issue #7) |
| XLE Energy | 30.5 | rupture | Rotated out of CORE — Issue #10 epicenter (one-week tenure) |
| XLRE Real Estate | 28.7 | rupture | Contagion epicenter emitter (top-3, sys_norm 0.105) — prev epicenter Issue #8 |
| XLU Utilities | 27.8 | rupture | Rate-sensitive long-duration absorber |
| XLB Materials | 24.1 | rupture | Rotated out of CORE — Issue #11 epicenter |
| XLY Consumer Discretionary | 24.1 | rupture | Contagion epicenter emitter (top-3) — prev epicenter Issue #9, part of June growth-rates triplet |
| XLI Industrials | 21.8 | rupture | Cyclical (prev epicenter Issue #7) |
| XLF Financials | 20.9 | rupture | Co-emitter (bank majors sold on beat, MS/GS −3%+) |
| XLK Information Technology | 18.9 | rupture | Contagion epicenter emitter (top-3) — IBM readthrough, rate-sensitive duration |
| XLV Health Care | 18.7 | rupture | Defensive |
| XLP Consumer Staples | 15.4 | rupture | Defensive |
STOXX 600 — 20-sector two-prices ranking
| STOXX 600 sector | σ (%) | Regime | Transmission vector / role |
|---|---|---|---|
| STOXX600_Utilities | 51.1 | rupture | Widest — widest single-sector reading in the current series |
| STOXX600_Insurance | 41.9 | rupture | Rate-sensitive duration absorber |
| STOXX600_Banks | 35.6 | rupture | Rotated out of CORE — Issue #11 epicenter (three-week tenure) |
| STOXX600_Construction | 34.9 | rupture | Rate-sensitive cyclical |
| STOXX600_RealEstate | 34.2 | rupture | Rate-sensitive duration |
| STOXX600_PersHousehold | 34.0 | rupture | Cyclical consumer |
| STOXX600_Autos | 30.5 | rupture | Cyclical export |
| STOXX600_FinServices | 30.1 | rupture | Co-emitter (financial cluster) |
| STOXX600_OilGas | 29.4 | rupture | Commodity-linked (Brent +13% since Issue #11) |
| STOXX600_FoodBev | 29.2 | rupture | Contagion epicenter emitter (top-3) — defensive at emission root |
| STOXX600_Media | 27.1 | rupture | Communication |
| STOXX600_Telecom | 25.1 | rupture | Communication / rate-sensitive |
| STOXX600_Industrials | 24.9 | rupture | Cyclical |
| STOXX600_Health | 24.2 | rupture | Contagion epicenter emitter (top-3) — defensive at emission root |
| STOXX600_Broad | 23.8 | rupture | Aggregate index |
| STOXX600_BasicRes | 23.7 | rupture | Mining / commodity input |
| STOXX600_Retail | 23.5 | rupture | Contagion epicenter emitter (top-3) — consumer cyclical at emission root |
| STOXX600_Chemicals | 22.6 | rupture | Input-cost pass-through |
| STOXX600_Tech | 18.7 | rupture | SK Hynix / Samsung readthrough (Korean memory crash on week) |
| STOXX600_Travel | 9.3 | suture | Only suture on the panel (Middle East demand compression) |
Sub-manifolds — Gold and Brent
Gold closed the week at $4,023 — the biggest weekly fall in six weeks, per news consensus — while trading above its own geodesic anchor inside the S&P joint panel by roughly 125% (GLD sub-manifold σ 81%). The joint-panel reading captures the safe-haven flow: capital rotated into gold on the Middle East escalation and the AI-capex reallocation, even as spot slipped week-over-week on Fed-hawkish repricing. Two frames, one flow. Brent closed at $85.95, up 13% from Issue #11’s $76.01, on renewed US–Iran tensions and inflation concerns. Inside the S&P joint panel, the USO sub-manifold sits at σ 38%, above its joint geodesic by 46%, regime rupture. Commodities carrying a fresh risk premium but priced by tape flow, not by geometry.
What we observed, ex-ante
We do not predict events. We signal configurations. The growth-rates emission cluster — XLK, XLRE, XLY — has been sitting in the S&P manifold’s top-3 emission root since Issue #6 on 5 June, at the moment Samsung was promising 1,800% year-over-year profit growth and SK Hynix was reporting record HBM shipments. The fundamentals said buy. The topology said: this complex is structurally fragile, the emission root has settled here, any local trigger will crack it here. When KIS published its 8% profit-estimate miss on Monday 13 July, that trigger arrived. The −15% single-day KOSPI record was not a prediction we made. It was the local resolution of a fragility the manifold had been recording for six weeks. The value of the framework is not to name Monday’s catalyst. It is to name Sunday evening’s where.
New: the Sentiment/TSS Divergence dashboard
Coming to the live Sysmographe dashboard: a real-time cross-check between news sentiment (VADER NLP on the NewsAPI aggregate feed) and the manifold’s TSS reading, per asset class. This week’s example is textbook. S&P news sentiment: +0.15, slight bullish bias, neutral consensus. S&P manifold TSS: 49.5% Singularity. The dashboard flags the pair as a divergence: “TSS signals stress but news sentiment is positive — hidden risk, potential alpha.” Gold prints the opposite pattern — sentiment −0.43 bearish consensus while gold trades above its own joint geodesic by 125%. The divergence is the operational form of what these weekly readings have been describing since Issue #6. The dashboard makes it live.
For an allocator — four hedge re-costings for Monday nine
Why it matters → Four positions that Issue #10’s and Issue #11’s readings implied and this week’s tape confirmed.
- Growth + rate-sensitive complex (XLY / XLK / XLRE). The S&P manifold’s emission root has sat on this triplet for three consecutive weeks. If XLK exposure was hedged against XLE (Issue #10’s CORE) or XLB (Issue #11’s), the hedge is on the wrong leg. Re-cost against a duration or breakeven leg — the Macro manifold is telling you that is where the equity outflow is landing.
- June IPO cohort — SpaceX inside. The largest stock debut in history is trading below its own issue price six weeks post-debut. Mark to market against the risk that the whole June cohort re-prices toward IPO-minus. The manifold’s XLY/XLRE emission root captures the growth-optimism unwind mechanically.
- European defensive book. Utilities widest at σ 51%, Health/Food/Retail as emission root: European defensives are being priced as the source of the widening, not its shelter. Re-cost European defensive hedges against a rotation into cyclicals or into cash. Do not assume the classical defensive-absorber behaviour holds this week.
- Cash-as-diversifier — not the yield question, the correlation one. The T-bill remains an attractive yield instrument — 4-5% annualised, no nominal risk. What has changed is its cross-asset role. US_3M_Bill σ 94%, seventh consecutive week widening: on the joint 77-node macro panel, the T-bill has stopped moving independently of the other assets. Historically the T-bill sat near its geometric equilibrium (σ 50-60%) and absorbed portfolio variance when equities and credit moved. At σ 94% it now moves with the panel — it has become a dispersing agent, not an absorber. If your VaR model treats T-bills as riskless residual — the classical Sharpe / Markowitz assumption — the model is at least one Issue behind the geometry. Keep the T-bill for yield. Do not count on it as your diversifier.
See these four re-costings applied to your own book →
Tactical horizon
What we observe. What we do not.
Observed. The S&P emission root has sat on the growth+rates complex for three Issues. The AI-capex reallocation shock erased roughly $120 billion of market capitalisation on the memory–software axis (IBM, SK Hynix, Samsung, Micron cluster) in five sessions. Separately, SpaceX has erased roughly $1 trillion in market capitalisation since its 16 June intraday peak — a scale of value destruction on a single mega-cap that concentrates the growth-tech complacency question in one name. The Macro Treasury complex absorbed the outflow without moving its emission root. Two Western equity manifolds diverged on the same news — the widest S&P–STOXX velocity divergence of the current series. US 3-month bill dispersion crossed past 94% for the first time.
Not observed, not stated. Whether the AI-capex reallocation is a one-quarter phenomenon or a structural shift. Whether the STOXX widening is a one-week event or the start of a persistent escape. Whether SpaceX below IPO holds or reverses on the next Starship launch narrative.
The manifold describes configurations. The resolution paths are for capital allocators and policy actors to decide.
See the reading on your own portfolio
This is Issue #12 of Three Manifolds — Weekly Market Reading.
- Institutional access programme → econosysmographe.com/institutional-access
- Methodology + 4 SSRN papers → econosysmographe.com/methodology
- Direct contact → contact@econosysmographe.eu
Sources
- TechMarketer — IBM 25% worst single day in company history
- BestStocks — IBM $68B market cap erased on capex shift confession
- Advisor Perspectives — SK Hynix plunge, biggest on record
- Motley Fool — SK Hynix 15% Korea semiconductor drop
- CNBC — SpaceX below $135 IPO price for first time
- TechCrunch — SpaceX crosses under IPO ahead of Starship launch
- Wikipedia — SpaceX IPO 12 June 2026, 4.2% float, lock-up schedule
- PurePowerPicks — SpaceX Lockup Schedule 2026-2027
- CNBC — SpaceX insiders early release provisions
- Motley Fool — SpaceX lock-up expiration insider selling analysis
- CNBC — JPM, BofA, Citi Q2 2026 bank earnings takeaways
- TradingKey — Morgan Stanley −3.41% on 16 July
- Yahoo Finance — Stock market close, 17 July 2026
- ETF Trends — Treasury yields snapshot, 17 July
- CNBC — Treasury yields on fresh Middle East strikes
- ValueAddVC — Big Tech AI capex 2026, spending race
- Global Data Center Hub — Microsoft $190B capex plan Q3 FY2026
Educational purpose only. Not financial advice. SmartGreenInvest Ltd (Reg. England & Wales No. 14636473) is not an FCA-authorised firm.
By Evangelos Papadopoulos · Independent Researcher · econosysmographe.com