Google’s Best Quarter. Google’s Worst Week. $280 Billion Wiped.
Alphabet delivered record Q2 profits — beating consensus on both revenue and EPS. Then the stock fell 7% in three sessions, wiping roughly $280 billion in market capitalisation from a $4 trillion base. Who is right — the market re-pricing management’s AI capex vision, or Sundar Pichai defending long-term infrastructure investment? Speculative predation on a fundamentals-strong name, or governance in action? Our Tech Manifold Live, launched with this Issue, reads Google’s structural equilibrium at $283 — an anchor derived from the joint dispersion of 51 tech and macro assets, not a price target, not a forecast, and one that recomputes as the panel evolves.
Three Manifolds · Weekly Market Reading · Issue #13 · Sunday 26 July 2026 · Reading as of Friday 24 July 2026 close · 6 min read
If your book carries the tech mega-cap complex — GOOGL, MSFT, and the AI-capex infrastructure thesis broadly — this week the market cast a first, quantifiable vote on the strategy management has been asking capital to fund. It cast that vote against a name that had just delivered record profits. What the tape said is worth reading through: this is not a story about fundamentals missing. It is a story about capital allocation being contested at the mega-cap level, live.
Pre-earnings. GOOGL trading around $344, within the twelve-month sell-side consensus corridor. Wednesday. Alphabet released Q2 2026 earnings — record profits, beat consensus on both revenue and EPS, with Google Cloud revenue up 82% year-on-year to $24.8 billion and a cloud backlog of $514 billion signalling extraordinary AI-infrastructure demand. Alongside the print, management raised full-year 2026 capex guidance from a prior $180–190 billion band to $195–205 billion — a roughly $15 billion upward revision. Wednesday close. GOOGL at $335 — a first three-percent drop despite the numbers. Thursday. UBS became the first major broker to reduce its Alphabet price target — from $400 to $379, Neutral rating maintained — citing increased capex intensity and continuing higher hiring needs. The move places UBS eleven and a half percent below the 62-analyst consensus of $428. Thursday–Friday. GOOGL continued lower to $319.74 close. Roughly $280 billion in market capitalisation wiped in three sessions from a $4 trillion base. The S&P manifold in Singularity borderline at TSS 49.0%, all eleven sectors in rupture. The Tech Manifold Live at TSS 20.9% Singularity with velocity −0.69 — a five-fold acceleration in surface dynamics from mid-week’s reading.
The sell-side consensus reads this as a valuation reset on the AI-capex guidance repricing — a temporary market indigestion at the mega-cap infrastructure spend commitments. The market — meaning the aggregate flow that emptied $280 billion of book value from a fundamentally-strong name in three sessions — is voting on something else. The question every CIO carries into Monday is whether that vote is disciplined capital reallocation by fiduciary shareholders repricing management’s long-horizon AI infrastructure vision, or speculative predation on a beat-and-drop pattern extractable at scale. Both readings are consistent with the tape. The manifold reads the structural gap the vote opened, without adjudicating the motive. What it can say is that Google is now sitting 12.8% above its geometric equilibrium on the joint dispersion of 51 tech and macro assets — third-widest single-name rupture of the panel, alongside Gold and SAP, and above eight other tech single-names all more than ten percent above their equilibria (MSFT, Samsung, SK Hynix, PLTR, ARKX, STM, Sony, US 3-month bill).
Three numbers for Monday’s book review:
- $280 billion wiped in three sessions on a beat. Alphabet market capitalisation from roughly $4.00 trillion to $3.72 trillion, on record Q2 profits. The largest fundamentals-decoupled mega-cap move of the quarter.
- GOOGL σ +12.8% — third-widest rupture of the Tech Manifold. Closing the geometric gap arithmetically implies an eleven-percent path back to equilibrium — via spot converging down, or via geodesic re-anchoring upward as the panel re-computes. The framework does not commit to either path.
- 62-analyst consensus PT $428 vs UBS $379. UBS eleven and a half percent below consensus — the first crack in sell-side alignment with management’s AI capex vision. One broker moved this week. Consensus has not.
Below, the anatomy of each reading, the first public introduction of the Tech Manifold Live view, and the arithmetic the allocator carries into Monday nine.
Apply for Institutional Access — 20 spots, institutional only →
On the FCI, TSS, σ and epicenter notation → TSS is the Topological Stress Score, an intra-manifold measure of how far the joint sector-covariance structure has moved from its geometric equilibrium — a single scalar summarising the dispersion of the whole panel. Zones — Calm, Elevated, Tension, Singularity — carry the qualitative reading. FCI is the Financial Conditions Index, a 0–1 aggregate of macro-financial tightness that peaks near 0.9 in stressed regimes and eases toward 0.5 in accommodative ones. σ is the Two-Prices dispersion score: how far a single asset’s spot price sits from its geometric-equilibrium (geodesic) price on the curved manifold of correlation matrices, expressed as a percentage. The geodesic price is the value an asset would carry if it were perfectly aligned with the historical risk-premium structure of its cross-asset peers — an implied structural anchor derived from the joint dispersion of the panel, not a forecast or target. Higher σ = wider structural gap; ~90% is the manifold’s empirical ceiling. The regime label — rupture (stretched above geodesic), suture (compressed toward or below it), compression (a distinct third regime, more extreme than standard suture) — characterises the geometric state. Contagion zones describe a node’s topological position in the joint dispersion structure: CORE absorbs the most contagion-mediated stress and typically emits along the network’s transmission paths; induced carries directional emission along those paths; periphery sits at the structure’s edge. The epicenter is the node with the highest emission systemic norm across the network, regardless of its zone. σ (width), zone (topology), and epicenter (systemic norm) are three distinct measurements on the same manifold — the three-way triangulation of financial stress that few published frameworks currently surface. Full methodology at econosysmographe.com/methodology.
Two hedges to re-cost before Monday nine → (1) AI capex thesis concentration. If the book is long the AI infrastructure trade — GOOGL, MSFT, and the semiconductor supply cluster (Samsung, SK Hynix, STM, Sony) — this week’s tape carries a governance-layer signal the fundamentals miss. Every one of these names now sits more than ten percent above its geometric equilibrium on the Tech Manifold’s 51-asset joint dispersion. A book pricing these names on twelve-month sell-side consensus is running an exposure the market itself just voted against on Google. Re-cost the concentration against a diversified rate-sensitive leg or against cash — the governance dispute is layered on top of the sell-side price-target debate. (2) XLC sector-level exposure. Communication Services widened another five points this week to σ +40.6% — the widest single-sector S&P rupture and the largest single-week widening of the current series. Google is inside XLC. Sector-level ETF hedges that were sized against Issue #12’s +35.3% reading are one Issue behind the geometry. If the book’s XLC exposure is passive-index-tracked, the sector-wide dispersion is now the operative risk. Full four-point re-costing in the allocator section below.
What the tape said. What the manifold read.
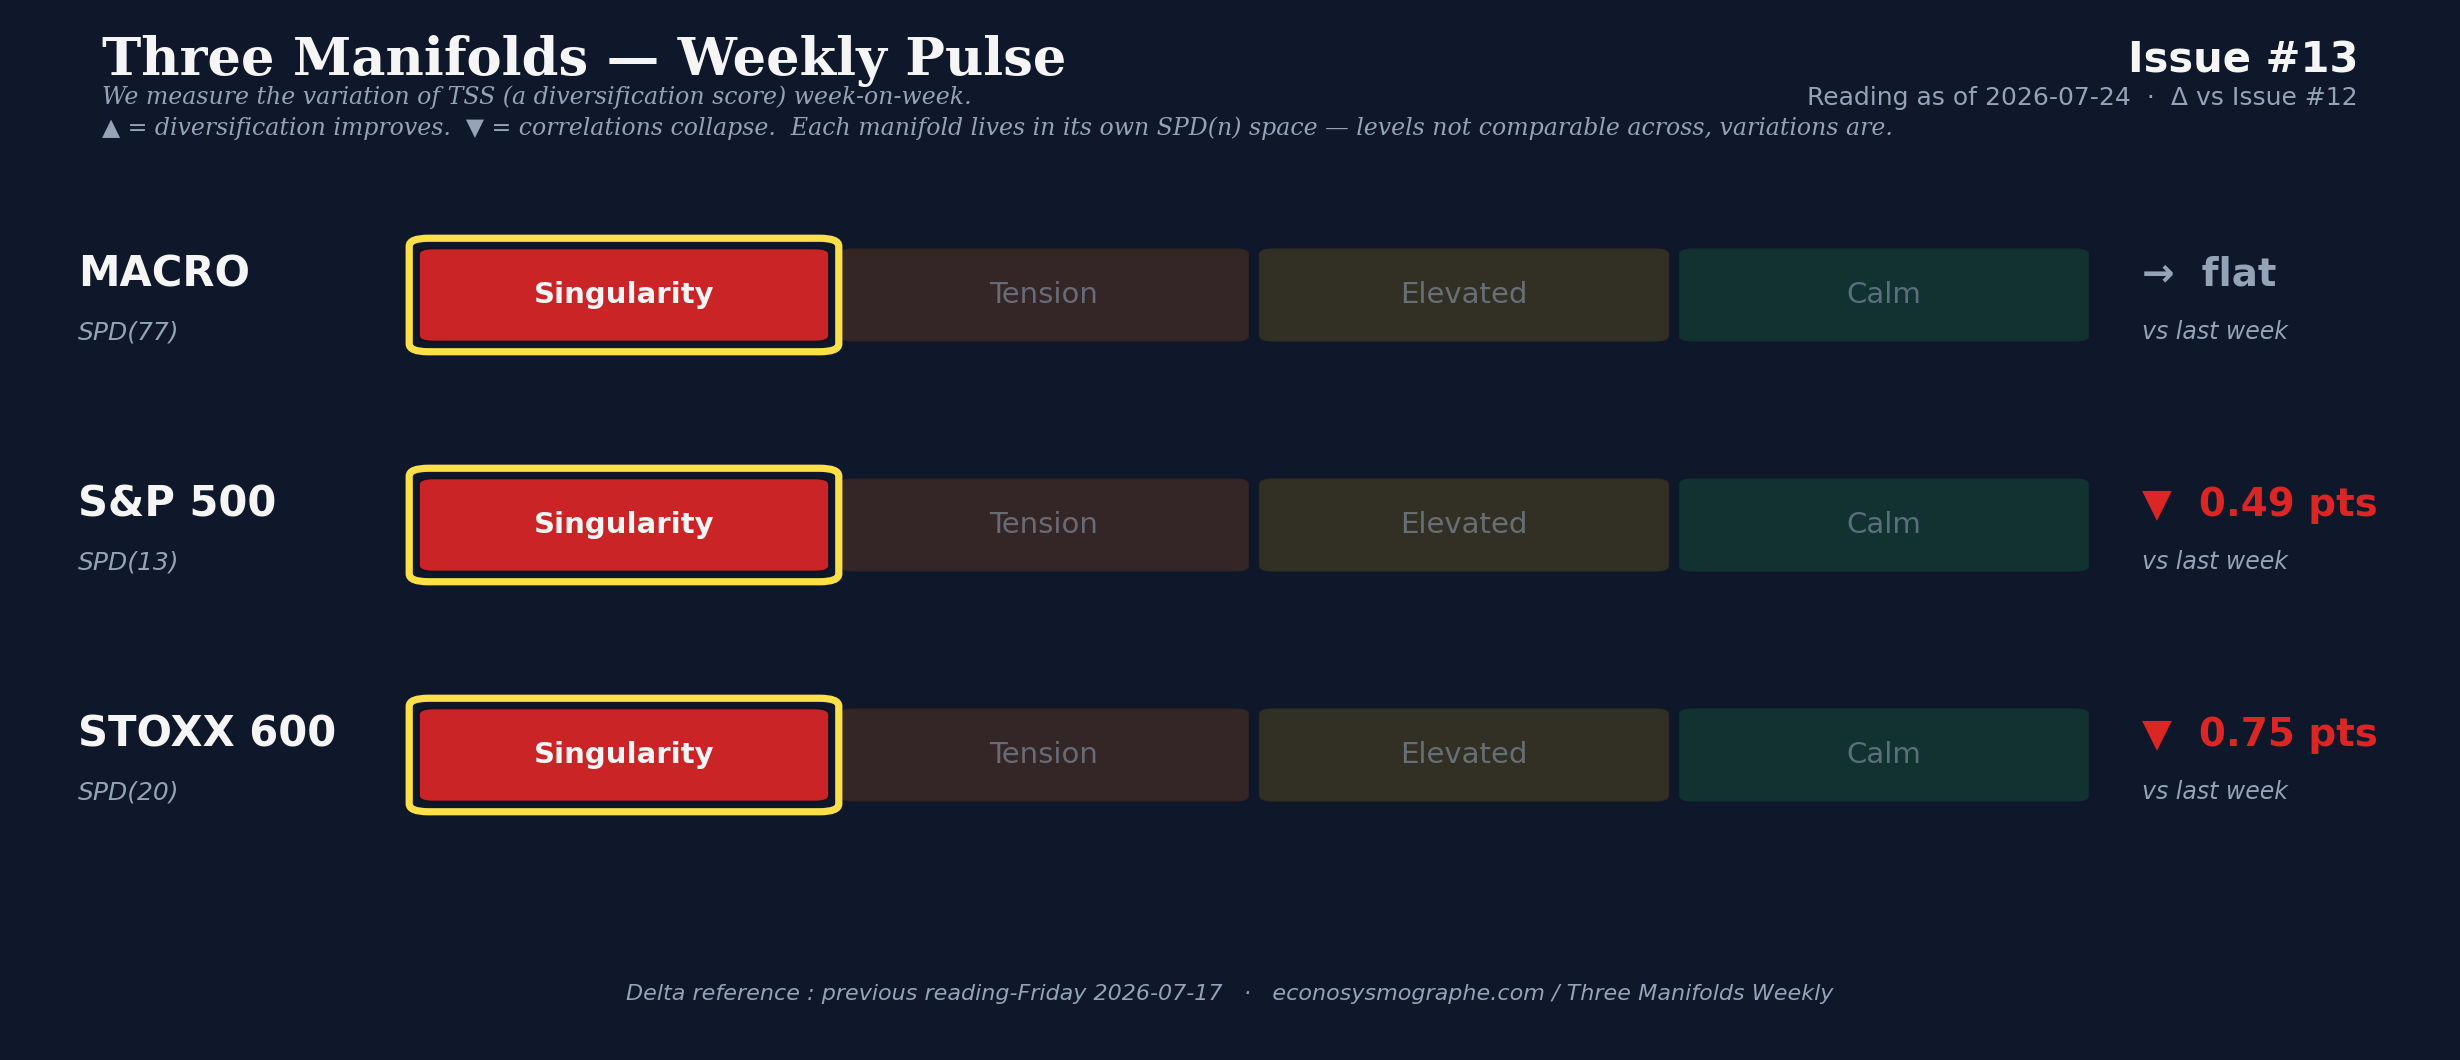
The Macro 77-node panel read TSS 0.4% Singularity (flat vs Issue #12), FCI 0.62 Moderate (▲ +0.02 vs Issue #12’s 0.60 — a slight tightening from the accommodative zone, not the easing narrative the aggregate financial-conditions read would suggest at first glance). Velocity slow_escape (+0.002, positive acceleration). Widest σ: US 3-month bill σ 94.6% above geodesic +158% — eighth consecutive week widening, past the 94% mark for the second Issue in a row. Cash and Treasury-duration remain the widest structural gaps at the surface level, but the T-bill has settled into the INDUCED zone — the surface widening has decoupled from the emission root. Where the emission has migrated is the reading worth carrying into Monday: the Macro contagion CORE cluster now emits from USD/MXN (epicenter) alongside US Unemployment, USD/JPY, DBA (agriculture ETF), and EUR/USD — a convergence of currency, commodity, and labour-market stress at the Macro emission root, with USD/CAD in the induced zone. The topology exposes a signature not surfaced in the prior twelve Issues: EM and dollar-bloc currencies emitting jointly with the US labour market print and an agriculture proxy — an early warning of the second-order channels through which the AI-capex re-pricing (visible at the S&P sector level) may transmit into the macro complex. Two distinct signals on the same panel — the aggregate FCI ticks up slightly, and the CORE cluster migrates into a new neighbourhood the prior Issues did not surface.
The S&P thirteen-node manifold read TSS 49.0% Singularity borderline (▼ −0.5 vs Issue #12, essentially flat), FCI 0.41 Stable (▼ −0.04, easing further from Issue #12’s 0.45), velocity slow_reversion. The Two-Prices classification stayed at eleven rupture and zero suture — the third consecutive Issue with every S&P sector above its own geodesic. Widest: XLC Communication Services σ +40.6%, five points wider than Issue #12’s +35.3% — the largest single-week widening on the panel and the widest reading of the current series. Epicenter: XLP (Consumer Staples), top-3 assets [XLP, XLV (Health Care), XLC], direction emission — a defensive-cluster emission node with Google’s Communication Services sector inside the top-3 emitters. The signal is unusual and worth reading carefully: the market is simultaneously rotating capital into defensive posture (XLP as epicenter) and widening the dispersion of the growth-and-AI names inside XLC (Google’s sector at +40.6%). Two distinct geometric mechanisms on the same panel — one signals capital reallocation into defensives, the other signals continued dispersion of the AI-capex growth names. The governance-layer read of the week — the market discipline on Google’s AI capex vision — is inscribed in the intersection of these two mechanisms.
The STOXX 600 twenty-node manifold read TSS 37.6% Singularity (▼ −0.7 vs Issue #12, essentially flat compression), FCI 0.37 Calm (flat), velocity slow_escape (+0.004 positive acceleration — still widening at panel level despite the sector-level modest compression). Widest: STOXX600_Utilities σ +47.1% above geodesic +60% — down from Issue #12’s +51.1% but still the widest single-sector reading of the panel. Two-Prices classification: nineteen rupture and one suture (Travel & Leisure, σ +11.4%). Epicenter: STOXX600_Health, top-3 [Health, Food & Beverage, Retail] — the defensive emission cluster from Issue #12 is fully maintained. European defensives continue leading the widening, not absorbing it. The two Western equity manifolds continue describing the same tape in different geometric language: the S&P concentrates the surface widening on Communication Services while its epicenter rotates into defensives, and the STOXX distributes the widening across the defensive complex while its epicenter holds the same defensive triplet across two consecutive Issues.
Book the geometric reading on your own multi-asset book →

Introducing the Tech Manifold Live — first public view
This Issue introduces a new, dedicated tech-focused view: the Tech Manifold Live, a fifty-one-asset panel — forty tech companies globally and eleven macro variables — computed on the same URF-3 geometry as the Macro, S&P, and STOXX manifolds, but resolved on a single-name granularity the sector panels cannot deliver.
Panel geography: forty tech companies plus eleven macro anchors — fifty-one assets in total. The tech complex is US-centric: nine mega-caps (Apple, Microsoft, Google, Amazon, Meta, Nvidia, Tesla, Oracle, IBM), the semiconductor cluster (AMD, Micron, Broadcom, Applied Materials, Qualcomm, Intel, plus ASML and STMicroelectronics on the European listings), networking and edge infrastructure (Cisco, Cloudflare), the cybersecurity-and-cloud layer (Palo Alto Networks, CrowdStrike, Datadog, MongoDB, Salesforce, Snowflake), the AI-native and post-IPO cohort (Palantir, CoreWeave, Nebius, ARM), the AI-adjacent frontier (Marvell, KLA, Arista), and a space-thematic ETF exposure (ARKX). The Asian coverage carries six names (Samsung, SK Hynix, TSMC, Sony, Tencent, Alibaba). The European coverage adds SAP as an enterprise-AI proxy. The eleven macro anchors are US 10-year yield, 2-year yield, 3-month bill, 10-year real yield, 10-year breakeven, DXY, gold, Brent, VIX, HY credit spread, and the MSCI Energy index.
Reading Friday 24 July close: TSS 20.9% Singularity, FCI 0.45 Stable, entropy 4.00 near its 4.01 mean, manifold velocity −0.69 (slow_reversion label). The velocity reading is five times the value the panel carried three trading days earlier — a first-time observation of that scale in the panel’s internal history (the Tech Manifold has been computed daily on our infrastructure since October 2024, but reported publicly for the first time in this Issue). Two-Prices distribution: zero compression, forty assets in suture (σ̄ +5.1%, the panel’s geometric equilibrium), eleven assets in rupture (σ̄ +12.1%). The eleven rupture names are, in order of σ:
Gold +14.9% · SAP +13.0% · GOOGL +12.8% · US_3M_Bill +12.4% · Sony +12.4% · STM +12.3% · PLTR +11.3% · ARKX +11.2% · MSFT +10.9% · Samsung +10.8% · SK_Hynix +10.7%.
Three observations the sector-level manifolds cannot deliver: first, the rupture is concentrated on eleven individual names rather than distributed across the whole tech complex — seventy-eight percent of the fifty-one assets sit at their geometric equilibrium. Second, Google is inside the top-three, alongside Gold and SAP — the three widest single-name ruptures of the panel. Third, the mega-cap cluster (GOOGL, MSFT, PLTR) coexists in rupture with the semiconductor-and-hardware cluster (Samsung, SK Hynix, Sony, STM) — a co-emission the S&P thirteen-panel would smooth across XLK and XLC sector aggregates.
A dedicated landing and monthly report cadence will launch in early August. This Issue is the first public reading.
On the geodesic anchor and what it is not → A sell-side price target is a forward assertion — the analyst is stating a view on what a name will be worth in twelve months. The geodesic anchor is structural, not forward. It describes where the joint dispersion of the panel would place a name’s price if that name were perfectly aligned with its cross-asset peers today. The two objects are epistemically different. The gap between spot and geodesic can close via two symmetric mechanisms: (a) spot converging toward geodesic — the mean-reversion path the drawdown scenario implies; or (b) geodesic converging toward spot — the anchor re-computes as fundamentals evolve and the panel’s dispersion structure absorbs new information. Both paths are equilibrium-restoring. The framework does not commit to one path, does not carry a timing, and does not carry a magnitude for either. It documents the current gap. Configuration is not prediction. The $283 reading for Google is Friday 24 July’s structural anchor — it will migrate as the panel evolves, and future Issues will document that migration.
S&P 500 — 11-sector two-prices ranking
| SPDR sector | σ (%) | Regime | Transmission vector / role |
|---|---|---|---|
| XLC Communication Services | 40.6 | rupture | Widest — +5.3 pts vs Issue #12, largest single-week widening. Google’s sector. Top-3 emitter within the epicenter cluster. |
| XLRE Real Estate | 31.4 | rupture | Rate-sensitive duration (prev epicenter Issue #12) |
| XLE Energy | 30.2 | rupture | Commodity-linked (essentially flat vs Issue #12) |
| XLU Utilities | 28.7 | rupture | Rate-sensitive long-duration absorber |
| XLB Materials | 25.6 | rupture | Cyclical (Issue #11 epicenter) |
| XLY Consumer Discretionary | 25.5 | rupture | Growth-rates cluster (▲ +1.4 vs Issue #12) |
| XLF Financials | 22.7 | rupture | Co-emitter (▲ +1.8 vs Issue #12) |
| XLI Industrials | 22.5 | rupture | Cyclical |
| XLV Health Care | 19.5 | rupture | Top-3 emitter within the epicenter cluster |
| XLK Information Technology | 18.8 | rupture | Growth-rates cluster (essentially flat vs Issue #12) |
| XLP Consumer Staples | 16.3 | rupture | Contagion epicenter — defensive rotation into emission (top-3 with XLV, XLC) |
Note on comparability → σ readings on the S&P 13-node panel (sector level) and the Tech Manifold Live 51-node panel (single-name level, introduced this Issue) are computed on distinct joint-dispersion structures. The two σ values are not directly comparable — each is calibrated to its own panel’s covariance geometry.
STOXX 600 — 20-sector two-prices ranking
| STOXX 600 sector | σ (%) | Regime | Transmission vector / role |
|---|---|---|---|
| STOXX600_Utilities | 47.1 | rupture | Widest — ▼ from Issue #12’s 51.1%, still widest single-sector reading |
| STOXX600_Insurance | 41.9 | rupture | Rate-sensitive duration absorber |
| STOXX600_PersHousehold | 37.8 | rupture | Cyclical consumer |
| STOXX600_Construction | 36.1 | rupture | Rate-sensitive cyclical |
| STOXX600_Banks | 35.4 | rupture | Rotated out of CORE — Issue #11 epicenter |
| STOXX600_RealEstate | 34.2 | rupture | Rate-sensitive duration |
| STOXX600_Autos | 33.2 | rupture | Cyclical export |
| STOXX600_FinServices | 31.3 | rupture | Co-emitter (financial cluster) |
| STOXX600_FoodBev | 30.0 | rupture | Top-3 epicenter emitter — defensive emission maintained from Issue #12 |
| STOXX600_Media | 28.6 | rupture | Communication |
| STOXX600_OilGas | 27.6 | rupture | Commodity-linked |
| STOXX600_Telecom | 27.4 | rupture | Communication / rate-sensitive |
| STOXX600_Industrials | 27.3 | rupture | Cyclical |
| STOXX600_BasicRes | 25.8 | rupture | Mining / commodity input |
| STOXX600_Broad | 24.9 | rupture | Aggregate index |
| STOXX600_Health | 24.6 | rupture | Contagion epicenter — defensive at emission root (unchanged from Issue #12) |
| STOXX600_Retail | 24.6 | rupture | Top-3 epicenter emitter — consumer cyclical maintained at emission root |
| STOXX600_Chemicals | 22.8 | rupture | Input-cost pass-through |
| STOXX600_Tech | 19.5 | rupture | SK Hynix / Samsung readthrough |
| STOXX600_Travel | 11.4 | suture | Only suture on the panel — Middle East demand compression |
Sub-manifolds — Gold and Brent (S&P joint panel)
| Sub-manifold | σ (%) | Above geodesic (%) | Regime | Reading |
|---|---|---|---|---|
| GLD (gold) | 77.9 | +118 | rupture | Widest sub-manifold — the safe-haven flow that absorbed the tech-drawdown outflow is priced above equilibrium by more than a factor of two |
| USO (Brent proxy) | 35.2 | +42 | rupture | Commodity risk premium priced on the joint panel — carries structural risk that the discretionary tape flow does not surface |
Both commodity sub-manifolds are in rupture on the S&P joint panel — Gold at σ +77.9% is the widest single reading of the S&P joint frame this Issue, above its geodesic by roughly 118%. A book carrying gold as an equity-drawdown hedge is running a hedge that itself sits inside the widest structural rupture the framework surfaces this Issue. The flow logic — safe-haven bid absorbing equity outflow — holds; the geometric arithmetic writes gold’s own mean-reversion risk on the same page as the equity mean-reversion.
Brent, priced through the USO proxy on the S&P joint panel, sits at σ +35.2% — commodity risk premium still elevated but well below gold’s dispersion. Neither reading comments on the discretionary short-term path of the underlying commodity price; both describe the structural gap between spot and joint-panel geodesic.
What the reading captured — and what a live governance dispute looks like in the geometry
We do not predict events. We signal configurations. The Tech Manifold Live surfaces today, for the first time in this publication, an eleven-name rupture cluster in which Google sits third by σ. The framework has not previously commented on Alphabet as a single name — the S&P thirteen-panel readings across Issues #6–#12 tracked the growth-rates emission cluster (XLK, XLC, XLRE) at the sector level, without resolving single names inside it. What the Tech Manifold delivers this Issue is the resolution the sector view could not: eleven individual tech names whose spot prices sit at least ten percent above their geodesic equilibria, and Google in that eleven. This week’s tape action is consistent with the structural configuration the manifold reads. It does not validate a prior single-name call — no such call was published. It documents, ex-post, that a name at the widest end of the manifold’s rupture ranking was also the name the market re-priced by roughly $280 billion in three sessions, on record profits.
There is a second observation here specific to Issue #13, and it concerns what the framework can say about governance disputes at the mega-cap level. When shareholders and management publicly diverge on the pricing of a long-horizon strategic commitment — as they did this week on Google’s AI capex vision — the disagreement leaves a signature in the geometry: the spot price migrates faster than the geodesic can re-anchor, opening a widening structural gap. That gap is not proof of who is right. Sundar Pichai may be defending an infrastructure vision that will prove itself over 2027–2029 as the AI infrastructure buildout compounds. The market may be exercising disciplined capital reallocation, telling management to prove the ROI before receiving further reinvestment license. Both readings are equilibrium-consistent — one closes the gap by geodesic re-anchoring upward (management’s thesis validates), the other by spot converging downward (market’s re-pricing sustains). The framework will document whichever path the panel takes over the coming Issues. It does not adjudicate the motive. It records the current dispute in the pricing.
The magnitude of the market’s response is worth pausing on. The Q2 capex guidance revision — from a prior $180–190 billion band to $195–205 billion — carries a midpoint upward move of roughly fifteen billion dollars. The market’s price response in the same three sessions was a $280 billion market-capitalisation deletion. The ratio between the fundamental capex delta and the equity response is roughly nineteen-to-one. For every additional dollar of AI infrastructure commitment, the market erased nineteen dollars of book value on a name that had just delivered record profits, Google Cloud revenue up 82% year-on-year, and a $514 billion cloud backlog. A nineteen-times amplification does not, on its own, distinguish between two mechanisms both consistent with the tape. Disciplined market pricing of concentration risk on an AI-capex thesis whose ROI horizon extends into 2027–2029 is one reading. Speculative pattern extraction — beat-and-drop mechanically exploited on any negative headline regardless of the size of the underlying delta — is another. Both readings survive the ratio. What the framework can say is that a nineteen-times amplification is unusually large, and worth naming — a fact the news-desk descriptive coverage does not surface.
To place the magnitude in historical context: Meta lost $232 billion in a single trading session on 3 February 2022, on a Q4 earnings miss and weak forward guidance — a market-cap deletion that set the US single-day record at the time. Alphabet’s roughly $280 billion drawdown this week, spread over three sessions rather than concentrated in one, ranks comparable in absolute scale to the Meta 2022 event — but against a fundamentally different backdrop. The Meta 2022 crash followed a miss and a lowered forward guidance. Alphabet’s 2026 drawdown followed a beat and a raised forward capex commitment. The historical pattern for mega-cap value destruction at this scale has been miss-and-warn; the current pattern is beat-and-raise-capex. That inversion is the observation worth carrying: the mechanism through which large-cap value is destroyed by the tape has changed shape.
There is a broader structural change underneath the single-name dispute worth reading in the same frame. Alphabet paused share buybacks in the first two quarters of 2026 — zero repurchases in Q1 and zero in Q2, against $28.31 billion in the same period one year prior — with the entire cash flow redirected into AI infrastructure. The Q1 halt broke an eight-year streak: Alphabet had repurchased shares every single quarter since Q4 2017 without exception, until this year. On 1 June 2026, management announced a $84.75 billion equity capital raise (a $40 billion at-the-market program, $30 billion in underwritten offerings and mandatory convertible preferreds, and a $10 billion private placement subscribed by Berkshire Hathaway) — the largest equity issuance in the company’s history, entirely dedicated to funding the AI compute buildout. Concurrently, Alphabet approximately doubled its long-term debt in a single quarter, from roughly $46.5 billion to $98 billion, on the debt component of the June capital raise. Combined with this week’s $15 billion capex-guidance revision, the pattern is a three-axis capital-allocation regime shift: (1) suspension of shareholder returns via buyback, breaking an eight-year streak, (2) the largest equity issuance in Alphabet’s history diluting the existing base plus a doubling of long-term debt, and (3) higher recurring infrastructure spend. This week’s $280 billion market-capitalisation deletion, on record profits, is not the market’s response to a single quarter’s number. It is — read structurally — the market repricing the whole regime.
The immediate cost of that repricing is not evenly distributed. Warren Buffett’s Berkshire Hathaway — which had been quietly building an Alphabet position since Q3 2025, well before the June capital raise — subscribed a $10 billion private placement on 1 June 2026, priced at $351.81 per Class A share and $348.20 per Class C share. At Friday 24 July close of $319.74, the subscription is already sitting on an approximately nine-percent mark-to-market loss — roughly $455 million on the Class A slice alone in the seven weeks since pricing. Across the full $84.75 billion raise (with the at-the-market program pricing over June-July at similar levels), the aggregate mark-to-market loss on the subscribed capital is on the order of eight billion dollars. The investors who financed the AI-infrastructure buildout have, mechanically, absorbed the first tranche of the market’s re-pricing of that same buildout. The compact between management, existing long-term holders, June equity subscribers, and the market is now visibly under stress. Existing holders bore the drop on the tape; the June subscribers subsidised it by taking the mark-to-market loss on their subscription; the shorts who positioned pre-earnings extracted the beat-and-drop; management retains the infrastructure moat regardless. Alignment of interests across these four constituencies is structurally strained. The framework does not adjudicate whether the vision or the discipline is right; it documents that the pricing dispute is now visible in the joint dispersion, and that the cost distribution is unusually skewed.
Read from a financial-stability perspective, the geometry surfaces at least three transmission channels active on the same week. The corporate-credit channel: Alphabet’s long-term debt roughly doubled in a single quarter, from approximately $46.5 billion to $98 billion, on the debt component of the June raise — a marker of the broader investment-grade issuance funding the AI-infrastructure buildout across the mega-cap complex. The equity-dispersion channel: the S&P XLC sector at +40.6% rupture and eleven Tech Manifold names above +10.7% concentrate equity-market fragility on the AI-adjacent tech complex, a joint-dispersion concentration wider than any single-sector concentration the framework has surfaced in the current series. The cross-currency and labour-market channel: the Macro contagion CORE now emits jointly from USD/MXN, US Unemployment, USD/JPY, DBA, and EUR/USD — indicating that second-order effects of the AI-capex re-pricing are already priced into the joint dispersion of currency and labour-market signals. None of the three channels is individually surprising to a macroprudential reader; their simultaneous co-emission at the level of the joint manifold is the observation worth naming this Issue.
Two forward observations to keep in mind. First, the $283 Google equilibrium reading is Friday 24 July’s snapshot — the anchor will migrate as fundamentals evolve, panel dispersion re-computes, and news lands. If Google rallies over the next weeks and the geodesic re-anchors upward with it, the gap can close via that path as legitimately as via a spot drawdown; the framework will document either outcome as an equilibrium restoration, not as validation or invalidation of a prior view. Second, our value is a time-varying map of configurations, not a series of point predictions. The value of the framework is not to name Monday’s catalyst. It is to name Sunday evening’s where.
For an allocator — five hedge re-costings for Monday nine
Why it matters → Five positions the S&P sector reading, the Tech Manifold single-name reading, and this week’s governance dispute at the mega-cap level imply, given the tape.
- AI capex thesis concentration — the governance-layer risk (GOOGL, MSFT, and the semiconductor supply chain). The market this week priced a first, quantifiable divergence between shareholder appetite for and management commitment to the multi-year AI infrastructure buildout — on Alphabet specifically, with roughly $280 billion of market capitalisation wiped in three sessions despite record profits. A book long the AI capex thesis is running an exposure the market itself has now voted against on the largest single name in that thesis. This is a distinct hedging axis from the fundamentals-driven or the sell-side-consensus-driven decisions: the question the book must price is whether it is aligned with management’s long-horizon vision (bullish 2027–2029 infrastructure returns) or with the market’s disciplined-reallocation signal (near-term ROI over further reinvestment). Re-cost the concentration against a hedge that expresses that governance-uncertainty premium directly — a portfolio of cash and short-duration Treasuries, or a diversified rate-sensitive leg.
- Tech mega-cap concentration (GOOGL, MSFT, PLTR — single-name geometry). The Tech Manifold places Google, Microsoft, and Palantir all more than ten percent above their geometric equilibria — GOOGL specifically at σ +12.8%, top-three of the panel. A book with concentrated mega-cap exposure carries the mean-reversion arithmetic embedded in each individual reading. Re-cost single-name hedges against a diversified rate-sensitive leg (US 10-year duration, breakeven, or a portfolio of the Tech Manifold’s suture names) — not against sector-ETF wrappers, which the geometry is emitting from, not aligning with.
- XLC (Communication Services) sector-level exposure. Communication Services widened another five points this week to σ +40.6%, the widest single-sector S&P rupture and its widest reading of the current series. Google is inside XLC; so are Netflix, Meta, and the traditional media names. A sector-wide ETF hedge sized against Issue #12’s +35.3% reading is one Issue behind the geometry. Re-cost the XLC-level exposure against XLP (Consumer Staples, narrowest σ +16.3%) or against cash — the intra-sector paths inside XLC are secondary to the sector-wide dispersion now.
- Semiconductor-and-hardware cluster (Samsung, SK Hynix, Sony, STM). Four names inside the Tech Manifold’s eleven-rupture cluster carry Asian and European semiconductor exposure. This is a distinct cluster from the US mega-cap complex, and its rupture co-existing with the US names points at a broad tech-complex geometric stretch, not a US-idiosyncratic story. Books with concentrated memory or semiconductor equipment exposure carry the mean-reversion arithmetic on this leg too — Samsung σ +10.8%, SK Hynix σ +10.7%, Sony σ +12.4%, STM σ +12.3%.
- Gold-as-hedge — the correlation question, not the price question. Gold sits at the top of the Tech Manifold’s rupture ranking at σ +14.9%. A book carrying gold as an equity-drawdown hedge is running a hedge that itself sits at the widest end of the structural rupture ranking. The underlying flow logic — safe-haven bid absorbing equity outflow — holds; the geometric arithmetic — gold’s own spot 14.9% above its geodesic anchor — implies that gold carries its own mean-reversion risk that would fire in the same market state the equity hedge is meant to protect against. Keep gold for its flow role; do not count on it as the widest hedge leg when the manifold reads it inside the rupture cluster.
See these five re-costings applied to your own book →
Tactical horizon — observed, not observed, and three pre-registered scenarios
Observed. Alphabet delivered record Q2 profits — beating consensus on both revenue and EPS — and lost roughly $280 billion in market capitalisation in three sessions. UBS became the first major broker to cut its Alphabet target — from $400 to $379, eleven and a half percent below the 62-analyst consensus of $428. The Tech Manifold Live surfaced eleven single-name ruptures on its first public reading, with Google third by σ (+12.8% above its geometric equilibrium). The S&P XLC sector widened five points in one week to +40.6% — the largest single-week widening and the widest single-sector reading of the current series. The S&P contagion epicenter rotated to Consumer Staples with a defensive triplet [XLP, XLV, XLC] at emission. The Macro FCI ticked up to 0.62 (▲ +0.02 vs Issue #12) — a slight tightening of aggregate financial conditions, not the easing narrative the surface read would suggest. The Macro contagion epicenter migrated into an EM-currency neighbourhood (USD/MXN, US Unemployment, USD/JPY, DBA, EUR/USD) — a signal not surfaced in the prior twelve Issues. Both equity manifolds held Singularity for the third consecutive Issue.
Not observed, not stated. Whether the market’s re-pricing of the AI capex vision is disciplined fiduciary reallocation or opportunistic beat-and-drop pattern extraction — the framework records the pricing dispute, not the motive. Whether the Google-specific gap closes via spot converging down to the $283 anchor, or via geodesic re-anchoring upward as management’s infrastructure vision proves itself over the coming quarters. Whether the Tech Manifold’s eleven-rupture cluster is a snapshot or a persistent configuration — the manifold view is one Issue old in its public form.
Three pre-registered scenarios for the week ahead (28 July – 1 August 2026). Each scenario is a specific, falsifiable observation that Issue #14 will audit publicly.
- Scenario A — Sell-side alignment with UBS. If at least three additional broker desks revise their Alphabet twelve-month price target below $400 during the week of 28 July, the consensus is caving under UBS’s leadership. Reading: the market’s re-pricing is being confirmed by sell-side alignment — a governance-dispute resolution in the direction of shareholder discipline. Hedge implication: books long the AI-capex thesis re-cost against a diversified rate-sensitive leg (see allocator section #1).
- Scenario B — GOOGL mean-reversion via geodesic re-anchoring. If GOOGL spot rallies four percent or more during the week without sell-side price-target revisions, while the Tech Manifold’s geodesic anchor migrates upward toward the spot, the current gap closes via anchor convergence rather than via spot mean-reversion. Reading: the market’s July repricing was speculative, and the framework’s structural read is now consistent with the management vision. Hedge implication: re-establish AI-capex thesis positions with lower governance-uncertainty premium.
- Scenario C — Contagion extension XLC → XLK. If the S&P XLK (Information Technology) sector’s σ widens by three points or more in Issue #14, joining XLC in the +30% rupture zone, the dispersion has extended from Communication Services into the pure tech sector. Reading: the structural repricing of the AI-capex complex is broadening from a single-name event to a sector-wide re-anchor. Hedge implication: aggressive de-risking on all AI-adjacent single names, not just the Tech Manifold’s current eleven-rupture cluster.
Pre-registered falsifiers (Issue #14 audit thresholds). Two hard thresholds fixed ex-ante this Issue, verifiable publicly against Issue #14’s reading Friday 31 July close.
- Falsifier 1 (Tech Manifold rupture cluster). If the Tech Manifold’s eleven-name rupture cluster shrinks to seven or fewer names by Issue #14, the “structural rupture cluster” observation surfaced this Issue is invalidated — the reading was a snapshot, not a persistent configuration. The panel’s introduction as a stable analytical view would require re-examination.
- Falsifier 2 (Macro FCI regime). If the Macro FCI reverses below 0.60 by Issue #14, the “aggregate financial-conditions tightening” observation of this Issue is invalidated — the 0.62 reading was a one-week noise event, not a regime edge. The narrative “macro easing decoupled from equity stress” of Issues #10-#12 would remain the operative frame.
The manifold describes configurations. The resolution paths — timing, magnitude, catalyst, verdict — are for capital allocators and policy actors to decide. Issue #14, next Sunday, will publicly audit these three scenarios and two falsifiers against the reading of Friday 31 July close.
See the reading on your own portfolio
This is Issue #13 of Three Manifolds — Weekly Market Reading.
- Institutional access programme → econosysmographe.com/institutional-access
- Methodology + 4 SSRN papers → econosysmographe.com/methodology
- Direct contact → contact@econosysmographe.eu
Sources
- Yahoo Finance — GOOGL close 24 July 2026, consensus data, analyst coverage
- Yahoo Finance — Alphabet analyst estimates, 62 analysts, average price target $428
- CNBC — Alphabet Q2 2026 earnings takeaways: revenue beats, GOOGL stock sinks on 2026 capex hike
- Investing.com — Alphabet Q2 2026 earnings call transcript: shares fall on capex surge
- Futurum — Alphabet Q2 FY 2026: Google Cloud +82%, $514B backlog, rising AI investment
- Value Add VC — Alphabet’s $205B AI capex guidance 2026: what Q2 earnings raise actually buys
- Investing.com — UBS cuts Alphabet price target on capex and hiring concerns
- MarketBeat — Alphabet given new $379 price target at UBS Group (23 July 2026)
- Benzinga — Alphabet’s $200B AI binge has killed its stock buyback machine (Q1-Q2 zero repurchases)
- Bloomberg — Alphabet to raise $80 billion in equity capital for AI spending (1 June 2026)
- Alphabet Investor Relations — $80 billion equity capital raise announcement (1 June 2026)
- Alphabet SEC Form 8-K FY2026 — equity raise final terms + Berkshire Hathaway private placement pricing
- Yahoo Finance — Alphabet launches $80B capital raise with Berkshire Hathaway support
Educational purpose only. Not financial advice. SmartGreenInvest Ltd (Reg. England & Wales No. 14636473) is not an FCA-authorised firm.
By Evangelos Papadopoulos · Independent Researcher · econosysmographe.com