
Detect Systemic Risk Before It Hits Your Portfolio
Econosysmographe™ identifies structural market ruptures months before price volatility spikes.
Protecting Performance in a Non-Linear World
The Silent Cost of Invisible Risk
By the time volatility spikes, it is already too late to hedge. The financial crises of 2007, 2020, and the structural transition of 2024–2026 share one feature: structural fatigue was measurable in geometric space months before price collapse.
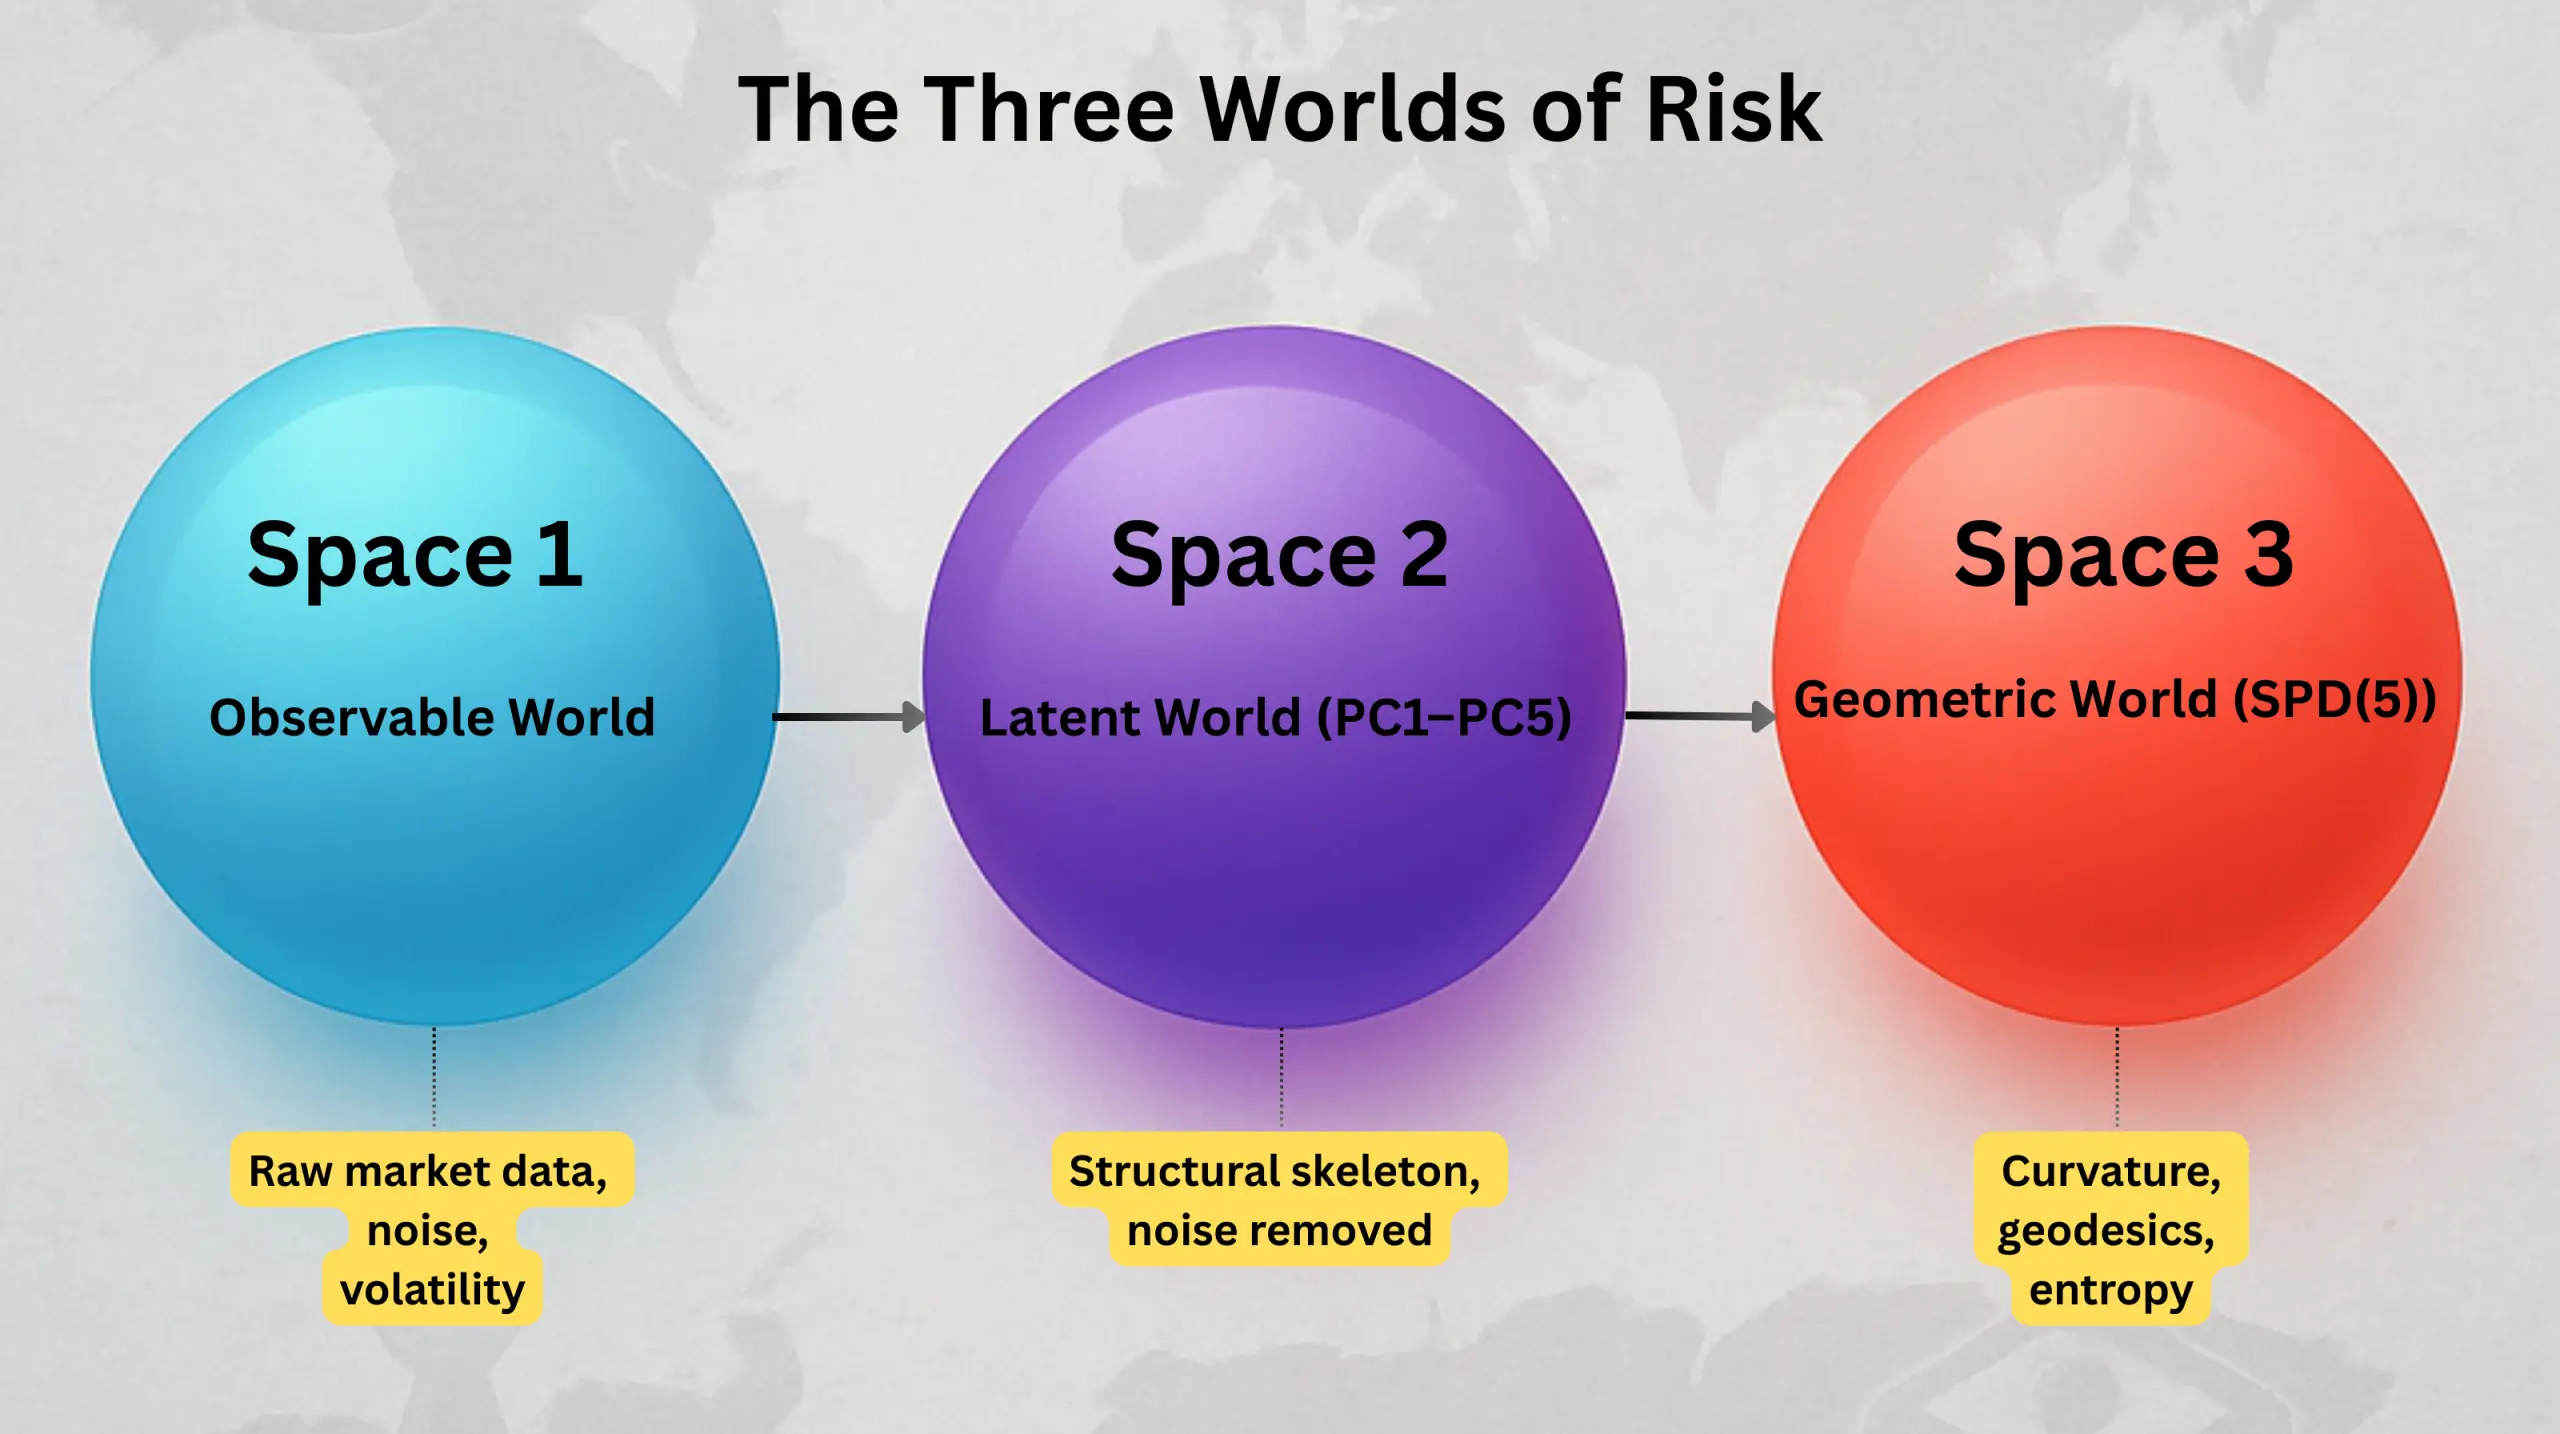
Beyond Traditional Volatility
Standard risk models — VaR, Sharpe, correlation matrices — treat markets as linear systems. They are blind to the curvature, geodesic stress, and topological deformation that precede systemic rupture. THE Econosysmographe™ was built to see what they cannot.
Three Geometric Signals. One Structural Edge.
TSS — Topological Survival Score: A single systemic health indicator (0% to 100%) computed across a 100-dimensional asset manifold. Below 15% indicates a Singularity Alert.
Two-Price Model: Computes a geodesic equilibrium price (G) vs spot price (S). Classifies assets into Compression (BUY), Suture (HOLD), or Rupture (EXIT).
Ricci Curvature: Identifies principal components under geometric stress and liquefaction risk before it appears in correlation matrices[cite.
Research & Downloads
The Universe Risk Framework (URF)
| Paper I Geometric Foundations |
Introduces the Papadopoulos Distance and Riemannian foundations of systemic risk. |
| Paper II Beyond Portfolio Death |
Demonstrates 18-month early warning signals for the 2008 collapse. |
| Paper III Why Martingales Cannot Predict Markets |
Introduces Two-Price Theory. Defines Compression, Suture, and Rupture regimes. |
| Paper IV The Minsky Singularity |
Identifies structural fatigue in macro-credit architecture (Jan 2026). |
| Paper V (NEW) The Geometry of Risk |
Forensic validation across Dot-com, GFC, COVID-19, and Trade War (2026). |