
The Fed’s Silence. The Market’s Abdication.
When the tape stopped pricing what it holds — gold and oil trading below their own geometry, the front-end climbing past its ceiling. Reading as of Friday 10 July 2026 close.
Three Manifolds · Weekly Market Reading · Issue #11 · Sunday 12 July 2026 · Reading as of Friday 10 July 2026 close · 7 min read
Key takeaways · 30-second read
- THE WEEK A missile struck a Qatari gas ship in the Strait of Hormuz Monday. The Fed’s June minutes landed hawkish Wednesday, with nine dots pointing higher and the Chair withholding his own. Trump declared the US–Iran ceasefire over on Friday. Brent closed the week +5% at $76.01. Gold retreated to $4,114 — roughly a quarter below its own geodesic price of $5,408. Every asset traded under its structural anchor.
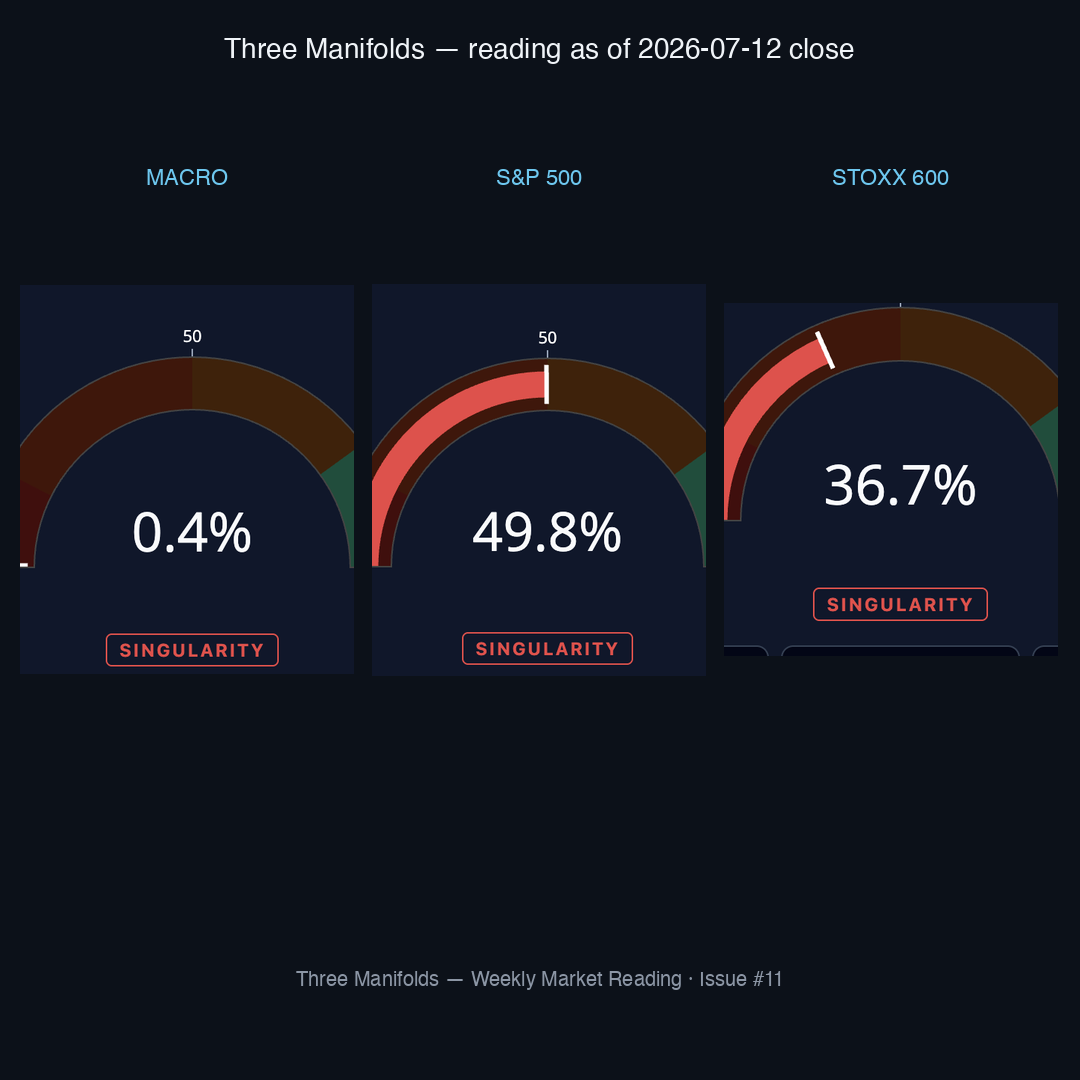
- MACRO 77 read: TSS held 0.35 Singularity, but FCI eased another −0.135 — the second consecutive weekly ease of the series, cumulative −0.24 across Issues #10→#11. Velocity flipped from `slow_reversion` back to `slow_escape` — a sign-change, not a re-amplification. The contagion epicenter rotated from SP500_Index to IEF: the top-3 systemic emitters are now IEF, US_10Y_Real_Yield and the 10Y breakeven. The Treasury duration complex is emitting. US_3M_Bill widened to σ 93.58% — sixth consecutive weekly climb.
- S&P 11 read: TSS eased −0.98 to 49.83 — zone shift Tension → Singularity. XLE rotated out of CORE after one week. XLB returned to the emission epicenter — closing a seven-week rotation loop across six distinct sectors back to its starting node. XLC widened to σ 39.43%, resuming the climb Issue #10 broke.
- STOXX 20 read: TSS 36.73 Singularity — seventh consecutive Singularity print. Utilities collapsed −10.2 σ-points in one week, breaking a five-week widening streak. European banks hold the epicenter for the third consecutive Issue at a systemic concentration the panel has never previously recorded (sys_norm 0.7046) — the manifold is reading Banks as the pressure point through which the rate cycle transmits into the European book.
Apply for Institutional Access — 20 spots, institutional only →
On the σ, zone and epicenter notation → σ is the Two-Prices dispersion score: how far an asset’s spot price sits from its geometric-equilibrium (geodesic) price on the curved manifold of correlation matrices, expressed as a percentage. Geodesic price, in plain terms, is the value an asset would carry if it were perfectly aligned with the historical risk-premium structure of its cross-asset peers — an implied structural anchor derived from the joint dispersion of the panel, not a forecast or target price. Higher σ = wider structural gap; ~90% is the manifold’s empirical ceiling. The regime label — rupture (stretched above geodesic), suture (compressed toward or below it), and compression (a distinct third regime where the spot sits significantly below geodesic, more extreme than standard suture) — characterises the geometric state. Contagion zones describe a node’s topological position in the joint dispersion structure: CORE absorbs the most contagion-mediated stress and typically emits along the network’s transmission paths; induced carries directional emission along those paths; periphery sits at the structure’s edge. The epicenter is the node with the highest emission systemic norm across the network, regardless of its zone. σ (width), zone (topology), and epicenter (systemic norm) are three distinct measurements on the same manifold. Full methodology at econosysmographe.com/methodology.
The week the tape stopped pricing what it holds
On Monday, a projectile struck a Qatari LNG carrier in the Strait of Hormuz — the first direct hit on Gulf gas infrastructure of the current cycle. Brent bid the next four sessions to close +5% at $76.01, midweek highs above $78 before Friday’s fade. That is not what a barrel priced on peace-deal fundamentals does. Strait of Hormuz transits, per tanker-tracking reports, are running near a standstill.
Tuesday, Samsung posted record chip profits and SK Hynix debuted on Nasdaq — the largest Asian tech IPO in years. The semiconductor complex, on cue, dropped 4.5% on the week. The tape kept the AI narrative in the headlines and sold the assets underneath it.
Wednesday, the June FOMC minutes landed hawkish. The Summary of Economic Projections showed nine of eighteen participants penciling at least one hike by year-end, eight holding, one cut — with the 2026 PCE median revised up from 2.7% to 3.6%, the largest single-cycle upward revision since the 2022 inflation surge. The committee dropped its easing bias. As the SEP release documents, the Chair’s individual projection column is unpopulated for the first time since the dot plot was introduced in 2012. The transcript of internal debate is now, for the first time in fourteen years, the primary source on where the Chair stands. He said nothing publicly. The market got the message anyway: the 10-year yield rose nine basis points on the week to 4.568%, its highest close since 22 May, and September hike odds fell from 66% to the mid-50s on the CME FedWatch.
Friday, Trump declared on Truth Social that the US–Iran ceasefire was “OVER”. Brent gave up 0.4% on the day but held the week’s gain; the risk premium in oil sits back at midweek levels. In equities, the S&P 500 closed +1% on the week at 7,575.39; the STOXX 600 barely moved (+0.04% Friday), finishing the week flat after Issue #10’s record close. Gold retreated: the August futures opened Friday at $4,135.40 and traded down to $4,115 through the New York session.
That is the tape’s version of the week. It reads as a coherent risk-cycle story: geopolitical premium in oil, a hawkish Fed, a semiconductor rotation, a resilient S&P, a flat Europe.
The three manifolds do not read the week that way. On the joint dispersion structure, gold sits roughly a quarter below its own geodesic price ($4,114 vs $5,408). Brent trades ten dollars under its structural equilibrium ($76.01 vs $86.27). The S&P panel shifted zone. The macro panel rotated its emission root from equities to the Treasury duration complex. Each configuration says the same thing, in a different frame: the tape kept pricing narratives and stopped pricing structure. When four asset classes trade below their own geometry in the same week, it is not fear — the volatility indices are compressed. It is not correction — the indices closed higher. It is what happens when the marginal buyer stops doing the pricing work and just settles the tape at the last print. This week the tape stopped pricing what it holds.
Apply for Institutional Access — read your cross-asset book →
MACRO 77 nodes — the Treasury complex takes the emission root
Why it matters → The tape read a hawkish Fed and a labor-market miss and left the macro anchor untouched. The 77-node manifold read a phase without a level — velocity flipped sign, FCI eased sharply, TSS did not move, and the contagion epicenter rotated out of equities and into Treasury duration. Gold and Brent, in their submanifolds, closed the week below their own structural prices.
- TSS 0.35 → Singularity (Δ −0.02 vs Issue #10 — near-flat).
- FCI 0.596 → Moderate (Δ −0.135 — largest single-week ease of the series, following Issue #10’s −0.11; cumulative −0.24 across two weeks).
- dp_velocity +0.0023 →
slow_escape(vsslow_reversion−0.004 at Issue #10 — sign flip, no re-amplification: the acceleration re-crossed zero but stayed micro). - Two-Prices: 70 rupture / 7 suture / 0 compression across 77 cross-asset nodes — 90.9% rupture, unchanged vs Issue #10. σ_abs_mean 32.18%.
- Widest: US_3M_Bill σ 93.58%, rupture. (σ 88.8 → 89.3 → 89.8 → 90.3 → 93.1 → 93.58 across Issues #6→#11 — six-week monotonic climb. Now 3.58 points past Issue #8’s flagged σ 90% amplification threshold; +0.48 this week alone.)
- Second widest: M2_Money_Supply σ 89.73%, rupture — cumulative 145.3% above geodesic.
- Contagion epicenter: IEF (7–10Y Treasury ETF, CORE zone, sys_norm 0.0299). Top-3 emitters: IEF, US_10Y_Real_Yield, Breakeven_Rate_10Y — the Treasury duration complex, in its three separable dimensions, is now the emission root.
Three specific structural facts underneath the tape’s coherent read.
First, the epicenter rotated out of equities. Issue #10 recorded SP500_Index at the macro emission root — the S&P was central to the cross-asset dispersion structure the week Warsh held rates. In seven days, the top-3 systemic emitters have shifted to IEF (7–10Y duration), US_10Y_Real_Yield (real-rate transmission), and the 10-year breakeven (inflation-expectation carrier). Where classical macro frameworks read a coherent risk-cycle story from the tape — geopolitical premium, hawkish Fed, resilient S&P — the joint manifold reads the whole risk cycle as a Treasury phenomenon. The dispersion is not being emitted by equities responding to rates. It is being emitted by rates responding to the reset in inflation expectations that Wednesday’s SEP revision (2.7% → 3.6% PCE 2026) codified.
Second, US_3M_Bill widened another 0.48 point to σ 93.58% — sixth consecutive weekly climb. The manifold’s empirical ceiling on the front-end sits near σ 90%; Issue #8 flagged that ceiling as the amplification-regime threshold. The current σ 93.58% is a print past that ceiling — three consecutive Issues above the flagged threshold, with the trajectory still widening rather than mean-reverting. Read as: the amplification regime the Issue #8 threshold was designed to detect is confirmed, and the front-end has not exited it. On a spot-price basis, the T-Bill YTD total return (the TBIL ETF proxy) reads 1.5599 vs a geodesic-equilibrium of 0.6119 — 154.9% above its structural anchor. The cash-as-ballast function has not just degraded; it has broken from the joint dispersion structure the rest of the panel occupies. This is not a hawkish repricing that has stabilised. It is a hawkish repricing that keeps compounding.
Third, gold and Brent each trade below their own asset-specific geodesic prices this week — a submanifold reading that adds a second frame to the joint dispersion read.
Gold submanifold — spot $4,114 · geodesic $5,408 · regime COMPRESSION. On the joint 77-node panel, gold reads σ 82.4% rupture — widening dispersion versus its cross-asset peers. On its own single-asset geodesic (A_GOLD = 319.27, methodology on SSRN 6212120), the spot sits roughly 24% below the structural equilibrium on a linear frame; the sub-manifold’s normalized dispersion score reads −28.5% and its regime label is compression. The two frames are consistent: gold is moving through the joint manifold rapidly (dispersion widening) and simultaneously trading below its own structural anchor (compression on its private geodesic). It is the geometry of an asset being sold without being re-priced.
Brent submanifold — spot $76.01 · 30-day MA fair value $82.75 · geometric equilibrium $86.27. Brent closed the week +5% on the ceasefire reversal, but the spot still sits $10.26 below its structural equilibrium. Underneath the geopolitical bid, the joint manifold reports Brent at σ 30.3% rupture — dispersion widening against the other 76 macro nodes. Same pattern as gold: asset moving through the joint frame while trading under its own anchor. A commodity carrying a fresh risk premium but priced by tape flow, not by geometry.
The Breakeven_Rate_10Y sits at σ 64.05% rupture, 89.7% above geodesic — the inflation-expectation carrier is the widest carrier in the panel outside of the front-end and M2. The Fed’s own SEP revision (2.7% → 3.6% PCE 2026) had a manifold analogue two weeks before it printed: the breakeven’s climb through the σ 60% band across Issues #9–#11 tracked the same trajectory the Fed committee walked in private. The manifold read the inflation-expectation phase shift as it was happening. The FOMC codified it Wednesday. What Warsh withheld individually, the panel had already emitted collectively.
US S&P 500 — the epicenter rotates out of energy, back into materials
Why it matters → The S&P eased −0.98 to a Singularity print of 49.83 — a zone shift, not a rally. XLE, the commodity-linked promotion of Issue #10, held CORE for one week before rotating out. XLB returned to the emission epicenter — closing a seven-week rotation loop across six distinct sectors back to its starting node. The rotation velocity itself is now the structural fact.
- TSS 49.83 → Singularity (Δ −0.98 vs Issue #10 — zone shift from Tension).
- FCI 0.423 → Calm (Δ +0.049 — modest tightening, opposite direction to Macro’s ease).
- dp_velocity −0.032 →
slow_reversion(vsslow_escape+0.003 at Issue #10 — sign flip). - Two-Prices: 11 rupture / 0 suture across 11 SPDR sectors — 100% rupture, unchanged.
- Widest: XLC σ 39.43%, rupture. (σ 40.0 → 38.3 → 40.1 → 41.8 → 43.3 → 37.8 → 39.43 across Issues #5→#11 — after Issue #10’s −5.5 breaker, the sector resumed its climb at +1.6 this week.)
- Contagion epicenter: XLB (Materials, CORE, emission, sys_norm 0.4432). Top-3 emitters: XLB, XLF, XLC.
| SPDR sector | σ (%) | Regime | Transmission vector / role |
|---|---|---|---|
| XLC Communication Services | 39.43 | rupture | Widest (climb resumed +1.6 after Issue #10 breaker) |
| XLE Energy | 30.33 | rupture | Rotated out of CORE after one-week promotion — Issue #10 epicenter |
| XLRE Real Estate | 29.65 | rupture | Rate-sensitive duration absorber (prev epicenter Issue #8) |
| XLU Utilities | 29.24 | rupture | Rate-sensitive long-duration absorber |
| XLB Materials | 25.13 | rupture | Contagion epicenter (CORE emission, sys_norm 0.4432) — returns after Issue #5 |
| XLY Consumer Discretionary | 24.90 | rupture | Rate-transmission to consumption (prev epicenter Issue #9) |
| XLI Industrials | 22.39 | rupture | Cyclical (prev epicenter Issue #7) |
| XLF Financials | 22.05 | rupture | Co-emitter (NIM proxy, top-3 emission cluster) |
| XLK Information Technology | 19.17 | rupture | Rate-sensitive duration (Semis −4.5% on week absorbed here) |
| XLV Health Care | 18.39 | rupture | Defensive |
| XLP Consumer Staples | 16.22 | rupture | Defensive |
Seven Issues, six distinct S&P epicenters: XLB → XLC → XLI → XLRE → XLY → XLE → XLB. The chain has now completed a full loop, closing on the sector where it started. XLE held CORE for one week — the shortest tenure of any epicenter in the arc. Energy’s promotion at Issue #10 did not persist; the panel rotated the emission systemic norm back to XLB (Materials, sys_norm 0.4432) with XLF (Financials) and XLC (Communication Services) as co-emitters. XLE reads σ 30.33% rupture — the second-widest sector this week — but its topological position has moved out of CORE.
The velocity of the rotation is not noise in the reading — it is the reading. A panel whose emission root cycles across six distinct sectors in seven weeks and closes back on itself describes a rate-cycle stress that has not concentrated on any single transmission vector. Books built on the assumption of multi-week epicenter tenure are exposed to that velocity as a structural feature of the current regime, not to any specific sector as an idiosyncratic bet. What the reading identifies is that stability of tenure has not yet re-emerged on the S&P panel.
That configuration reads as rate-cycle exposure concentrating in commodity-input pricing power rather than in commodity-price receiving. Materials-Financials-Communications carries cyclical earnings sensitivity to the input-cost pass-through and to the NIM curve steepening — not to the crude barrel itself, which is what XLE tracks. Books that hedged the Issue #10 XLE emission through crude futures or the barrel-tracked ETFs held a hedge that is now on the wrong sector. The commodity price rallied +5% on the week; the manifold moved its emission out.
XLC widened +1.6 to σ 39.43% — the Issue #10 breaker (−5.5) reversed almost immediately, and the sector resumed the climb it had run through Issues #5–#9. The widest sector on the panel is not the emitter this week, but the gap between widest and emitter narrowed. Sector rotation velocity is now the structural fact: no S&P epicenter has held for two consecutive Issues in the ten-issue-plus history of the reading.
DACH STOXX 600 — Utilities collapses, Banks concentrates
Why it matters → STOXX printed a seventh consecutive Singularity — the panel has now sat inside the widest zone for a cumulative +11.2 gain across Issues #5–#11. Utilities, the widest sector for five consecutive weeks, collapsed −10.2 points in one week. Banks holds the epicenter for the third consecutive Issue at sys_norm 0.7046 — the highest single-node dominance the STOXX panel has recorded. In one sentence: European banks are carrying the weight of the rate cycle for the panel, at a concentration the reading has never previously measured.
- TSS 36.73 → Singularity (Δ −0.14 vs Issue #10 — plateau after the +4.57 breakout).
- FCI 0.388 → Calm (Δ +0.016 — flat).
- dp_velocity −0.20 →
slow_reversion(vsslow_escape+0.08 at Issue #10 — sign flip, same direction as S&P). - Two-Prices (20 sub-sectors): 19 rupture / 1 suture / 0 compression — 95.0% sector rupture (+1 rupture vs Issue #10). σ_abs_mean 28.4%.
- Widest: STOXX600_Utilities σ 45.93%, rupture. (σ 43.3 → 45.5 → 46.0 → 56.1 → 45.93 across Issues #7→#11 — the five-week widening streak reversed −10.2 in one week.)
- Contagion epicenter: STOXX600_Banks (CORE, emission, sys_norm 0.7046). Top-3: Banks, Chemicals, Tech.
| STOXX 600 sector | σ (%) | Regime | Transmission vector / role |
|---|---|---|---|
| STOXX600_Utilities | 45.93 | rupture | Widest (5-week climb reversed −10.2 in one week) |
| STOXX600_Insurance | 40.44 | rupture | Rate-sensitive duration absorber |
| STOXX600_PersHousehold | 35.97 | rupture | Cyclical consumer |
| STOXX600_Construction | 35.47 | rupture | Rate-sensitive cyclical |
| STOXX600_Banks | 35.02 | rupture | Contagion epicenter (CORE emission, sys_norm 0.7046 — third consecutive Issue) |
| STOXX600_RealEstate | 33.81 | rupture | Rate-sensitive duration |
| STOXX600_Autos | 31.99 | rupture | Cyclical export |
| STOXX600_FinServices | 31.32 | rupture | Co-emitter (financial cluster) |
| STOXX600_FoodBev | 29.85 | rupture | Defensive |
| STOXX600_OilGas | 28.31 | rupture | Commodity-linked (Brent +5% on week) |
| STOXX600_Media | 27.12 | rupture | Communication |
| STOXX600_Telecom | 26.14 | rupture | Communication / rate-sensitive |
| STOXX600_Industrials | 25.98 | rupture | Cyclical |
| STOXX600_BasicRes | 24.32 | rupture | Mining / commodity input |
| STOXX600_Health | 24.28 | rupture | Defensive |
| STOXX600_Broad | 23.90 | rupture | Aggregate index (record close context) |
| STOXX600_Retail | 23.64 | rupture | Consumer cyclical |
| STOXX600_Chemicals | 21.66 | rupture | Co-emitter (input-cost pass-through, top-3 emission) |
| STOXX600_Tech | 19.06 | rupture | Co-emitter (SK Hynix / Samsung readthrough, top-3 emission) |
| STOXX600_Travel | 10.33 | suture | Only suture on the panel (Gulf-linked demand compression) |
Two structural facts on the STOXX panel this week.
Utilities collapsed. The widest sector of Issue #10 (σ 56.1% after five consecutive weekly widenings) contracted 10.2 points to σ 45.93% — the largest single-week reversal of the sector in the ten-Issue history of the panel. In the same week, the aggregate STOXX 600 index went from a record close to a flat print — Utilities alone accounts for approximately 40% of the panel’s dispersion reduction. What led the panel wider for five weeks has now led it back. The sector has not exited rupture — σ 45.93% is still the widest print on the panel — but the slope has reversed. Rate-sensitive long-duration absorbers, when they contract this fast, typically signal that the marginal buyer has re-set the discount rate: this week’s ten-year sold off nine basis points and Utilities gave up ten σ-points on the same signal.
Banks concentrates. STOXX600_Banks holds the emission epicenter for the third consecutive Issue with a systemic norm of 0.7046 — a number the panel has not previously carried at a single node. For context, the S&P panel’s XLB epicenter this week reads sys_norm 0.4432; the STOXX Banks concentration is roughly 60% higher. Scale caveat: sys_norm across panels of different node counts (11 SPDR sectors vs 20 STOXX sub-sectors) is a directional comparison, not a size-normalised one — the STOXX absolute reading nonetheless sits at a level the panel has not recorded in-sample. Where the S&P rotates its emitter weekly, the STOXX has consolidated onto one sector and kept concentrating. Banks-Chemicals-Tech as the top-3 emission cluster describes a rate-cycle exposure that is not being distributed across the panel: it is being pulled onto financials and the input-cost pass-through nodes. The tape’s coherent rally-broadening story from Issue #10 is not what the emission structure is doing. Rally-as-stress — a tape rally whose sector-level dispersion widens rather than compresses because the aggregate move concentrates on a narrow emission block — persists a third week.
STOXX600_Travel prints σ 10.33% suture — the only suture on the panel this week. Travel is the Gulf-demand-sensitive node of the European sector map; that it compressed while the rest of the panel held rupture reads as an early demand-side signal on the Strait of Hormuz story that has yet to translate to the tape.
FOR AN ALLOCATOR — what re-prices this week
Why it matters → The tape closed the week higher on the S&P and flat on the STOXX. Underneath, four asset classes trade below their own structural anchors, the macro emission root rotated from equities into Treasury duration, and the S&P sector rotation loop closed on itself. A book positioned on Issue #10’s readings carries two specific hedges that no longer match their emission legs.
The Energy hedge from Issue #10 is off the emission leg. XLE was the Issue #10 epicenter — commodity-linked promotion into the S&P CORE. This week Brent rallied +5% on the ceasefire reversal and the manifold rotated XLE out of CORE. Books that hedged the Issue #10 XLE emission exposure through crude futures or barrel-tracked ETFs now hold a hedge that tracks the price leg (which is where the risk premium re-appeared) but not the emission leg (which is where the manifold has moved — XLB Materials, sys_norm 0.4432). Two-week hedge lifespan is not a bug in the framework; it is a structural fact of the rotation velocity. Re-cost the XLE hedge as a commodity-price play, and rebuild the manifold emission hedge on the XLB–XLF–XLC cluster.
The Treasury duration complex is now the macro epicenter. IEF, US_10Y_Real_Yield and the 10-year breakeven read as the top-3 systemic emitters on the 77-node macro panel. Books that carry duration exposure — whether directly through TLT/IEF, through long-duration equity (rate-sensitive tech, Utilities, Real Estate), or synthetically through negative-carry positions — should read this as: the joint dispersion structure is being driven by rates repricing inflation expectations, not by equities responding to rates. Hedges built on the assumption that the dispersion emitter is equity (SP500_Index, as Issue #10 recorded) are now hedging a rotated exposure. The correlation-of-hedges assumption has shifted with the epicenter.
Cash-as-ballast has degraded further. US_3M_Bill σ 93.58%, sixth consecutive weekly climb, 3.58 points past the Issue #8 amplification threshold. Front-end volatility has not returned to normalise; front-end dispersion versus the joint panel keeps widening. Books that carry cash as the zero-beta anchor should model that anchor at its geodesic-equilibrium proxy (roughly 60% of the current TBIL YTD-return level, per the σ 93.58% reading), not at the observed spot. The gap is the structural risk premium being emitted by the front-end into the rest of the book.
Utilities’ reversal has one interpretation the tape did not price. STOXX600_Utilities dropped 10.2 σ-points in a week the ten-year sold off nine basis points. That is the marginal buyer re-setting the discount rate on European long-duration income assets. If the sector continues below the widening trajectory, the five-week climb was a discount-rate re-pricing arc, not a defensive rotation. Books long European Utilities as a defensive should distinguish between the two: one is over, the other has not started.
The sub-manifold reading on gold and Brent adds a second frame. Gold sits below its own geodesic ($4,114 vs $5,408 — roughly 24% under on a linear frame). Brent sits $10.26 below equilibrium ($76.01 vs $86.27). Books that hold either as diversifiers on the assumption of mean-reversion toward the structural price should note that both assets are moving through the joint manifold at the same time — dispersion is widening in the cross-asset frame while the spots trade under their own anchors. That is the geometry of an asset being sold without being re-priced. Whether the anchor holds, or whether the anchor itself resets lower, is the question a book carrying either exposure needs to price for the coming week.
European banks are the panel’s transmission pressure point. STOXX600_Banks holds the emission epicenter for the third consecutive Issue at sys_norm 0.7046 — the highest single-node dominance the STOXX panel has recorded. That is not a directional call on the sector’s equity price — Banks has been resilient at the tape. It is a structural read that Banks is the transmission node the manifold identifies as the first fracture point if the rate cycle continues to harden. Books that hedge Banks off equity beta only are not hedged for the geometric role Banks now carries; the emission signature does not track a beta hedge.
Apply for Institutional Access — read the manifold on your own portfolio →
Sources
- Summary of Economic Projections, June 17 2026 — Federal Reserve (SEP release documenting the dot plot columns)
- Federal Reserve issues FOMC statement — Federal Reserve Board
- Brent crude oil price and history — Trading Economics
- Oil heads for weekly gain as Middle East supply risks persist — Reuters/Yahoo Finance
- Stock Market Today, July 10: Markets Edge Higher and SK Hynix Soars on Debut — Motley Fool
- United States Government Bond 10-Year Yield — Trading Economics
- Gold Aug futures GC=F — Yahoo Finance
Correspondence: contact@econosysmographe.eu
Educational only · Not financial advice · Not a solicitation


