Tag: treasury-yields
-

The Fed’s Silence. The Market’s Abdication.
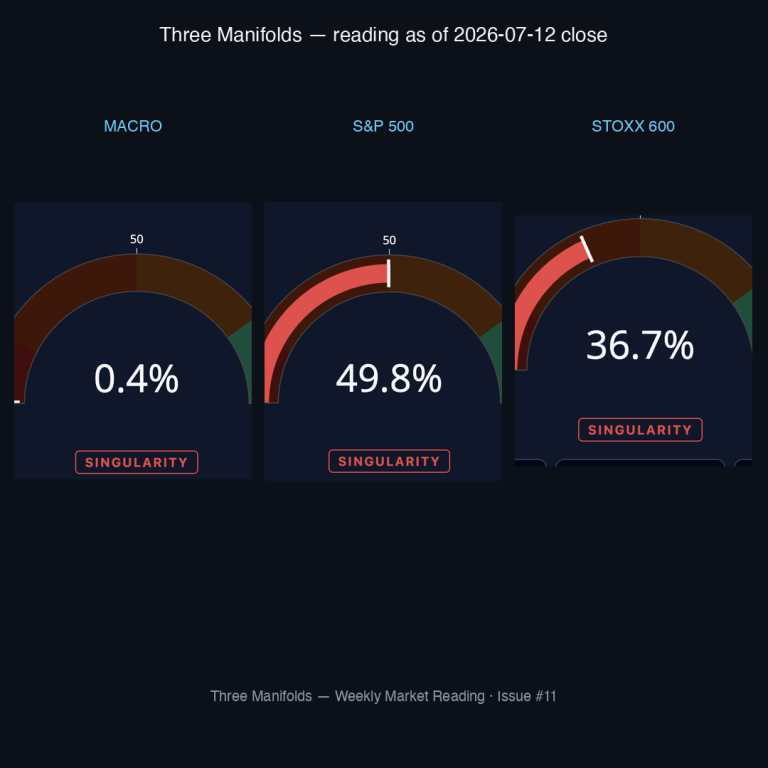
When the tape stopped pricing what it holds — gold and oil trading below their own geometry, the front-end climbing past its ceiling. Reading as of Friday 10 July 2026 close. Three Manifolds · Weekly Market Reading · Issue #11 · Sunday 12 July 2026 · Reading as of Friday 10 July 2026 close ·…
-
The Record-Breaking Rally Selling a False Sense of Calm
Underneath the peace deal, the payrolls miss, and a surging STOXX 600, market manifolds read a configuration the tape averages away. Three Manifolds · Weekly Market Reading · Issue #10 · Sunday 5 July 2026 · Reading as of Friday 3 July 2026 close · 7 min read Key takeaways · 30-second read THE WEEK…
-

Two Readings of the Same Selloff — Tech Headlines, Rate Geometry — and the T-Bill Crossed σ 90%
The press attributed this week’s S&P and Nasdaq losses to AI capex doubts and memory-stock fears. A quieter news thread — Fed hike expectations, jobs data in focus, gold’s fourth weekly loss — and the manifold’s contagion map both point to rate transmission as the structural driver. We read the two readings side by side.…
-
Four Central Banks Pivoted Hawkish. The S&P Closed +1%. Its Geometry Caught What the Index Smoothed Over.
The S&P 500 index gained 1% on Thursday and the dollar posted its best week since 2024. Under both surfaces, three independent epicenters — XLRE in the US, STOXX Construction in Europe, and the US 3-month bill at a +145% above-geodesic record — give the convergence its geometric signature. The price moved; the joint dispersion…
-
Hypercorrelation. And the Fed Is the Epicenter.
Five hedges, one exit — and the 3-month T-Bill (TBIL ETF) is the most geometrically divergent component on a 77-asset panel: +142.9% above its panel-derived equilibrium return path, an annualised ~2.5 percentage-point gap on the Fed Funds equivalent. The asset most controlled by the Fed is the one most disconnected from the rest of the…