Oracle Sold $20 Billion of Stock to Keep Building. The Epicenter Moved to Financials.
If this is what it costs to build AI, who is holding the bill?
Thursday night you read Oracle’s numbers twice: a $664 billion backlog, free cash flow of minus $5 billion, $20 billion of its own shares sold in the quarter. The ten-year at 4.95%, the Fed on Wednesday. Our reading is taken at Thursday’s close, before Oracle’s after-hours release: it contains the rates week, not Oracle’s numbers. At that close the stress sat with the companies financing the chips, not the ones buying them.
Data as of Thursday 10 September 2026 close · 6 min read
The reading in 30 seconds
Brent went from $102 to $109 during the week. The two-year yield rose 22 basis points to 4.56%, the ten-year 18 to 4.95%. Our reading is taken at Thursday’s close, before Oracle reported and before the weekend.
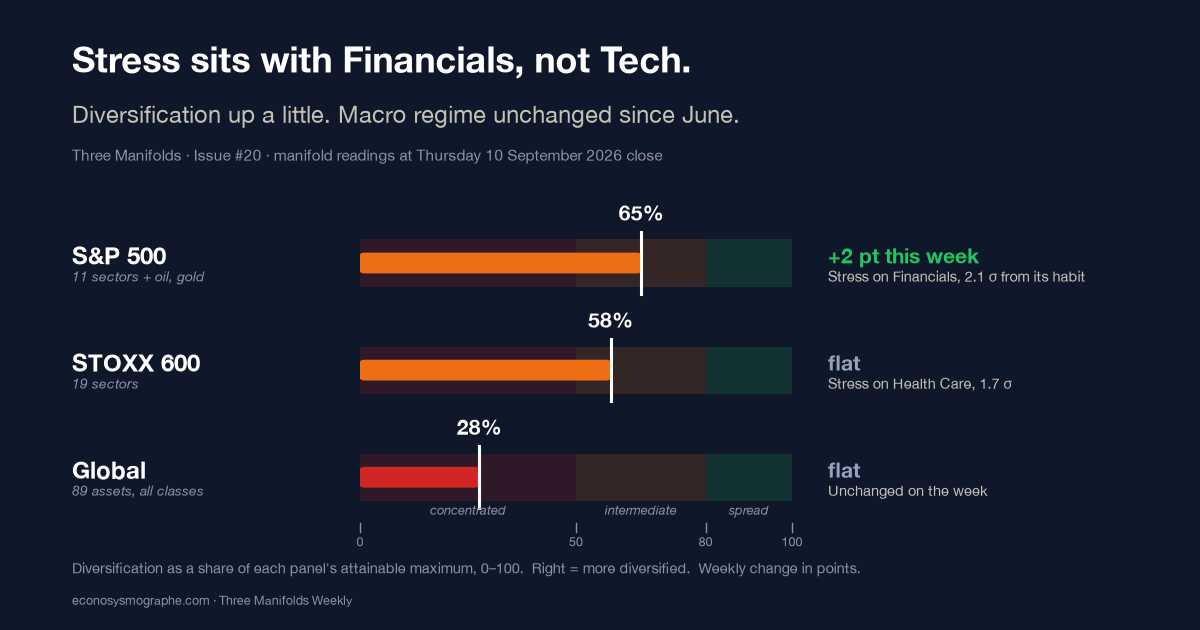
New York. The stress sits with Financials, the sector that carries the financing: 2.1 standard deviations from its own habit, with oil and Materials alongside. Technology stayed inside its usual range. This is not a technology story.
Europe. The stress left Construction for Health and Real Estate, the sectors most sensitive to long-term yields.
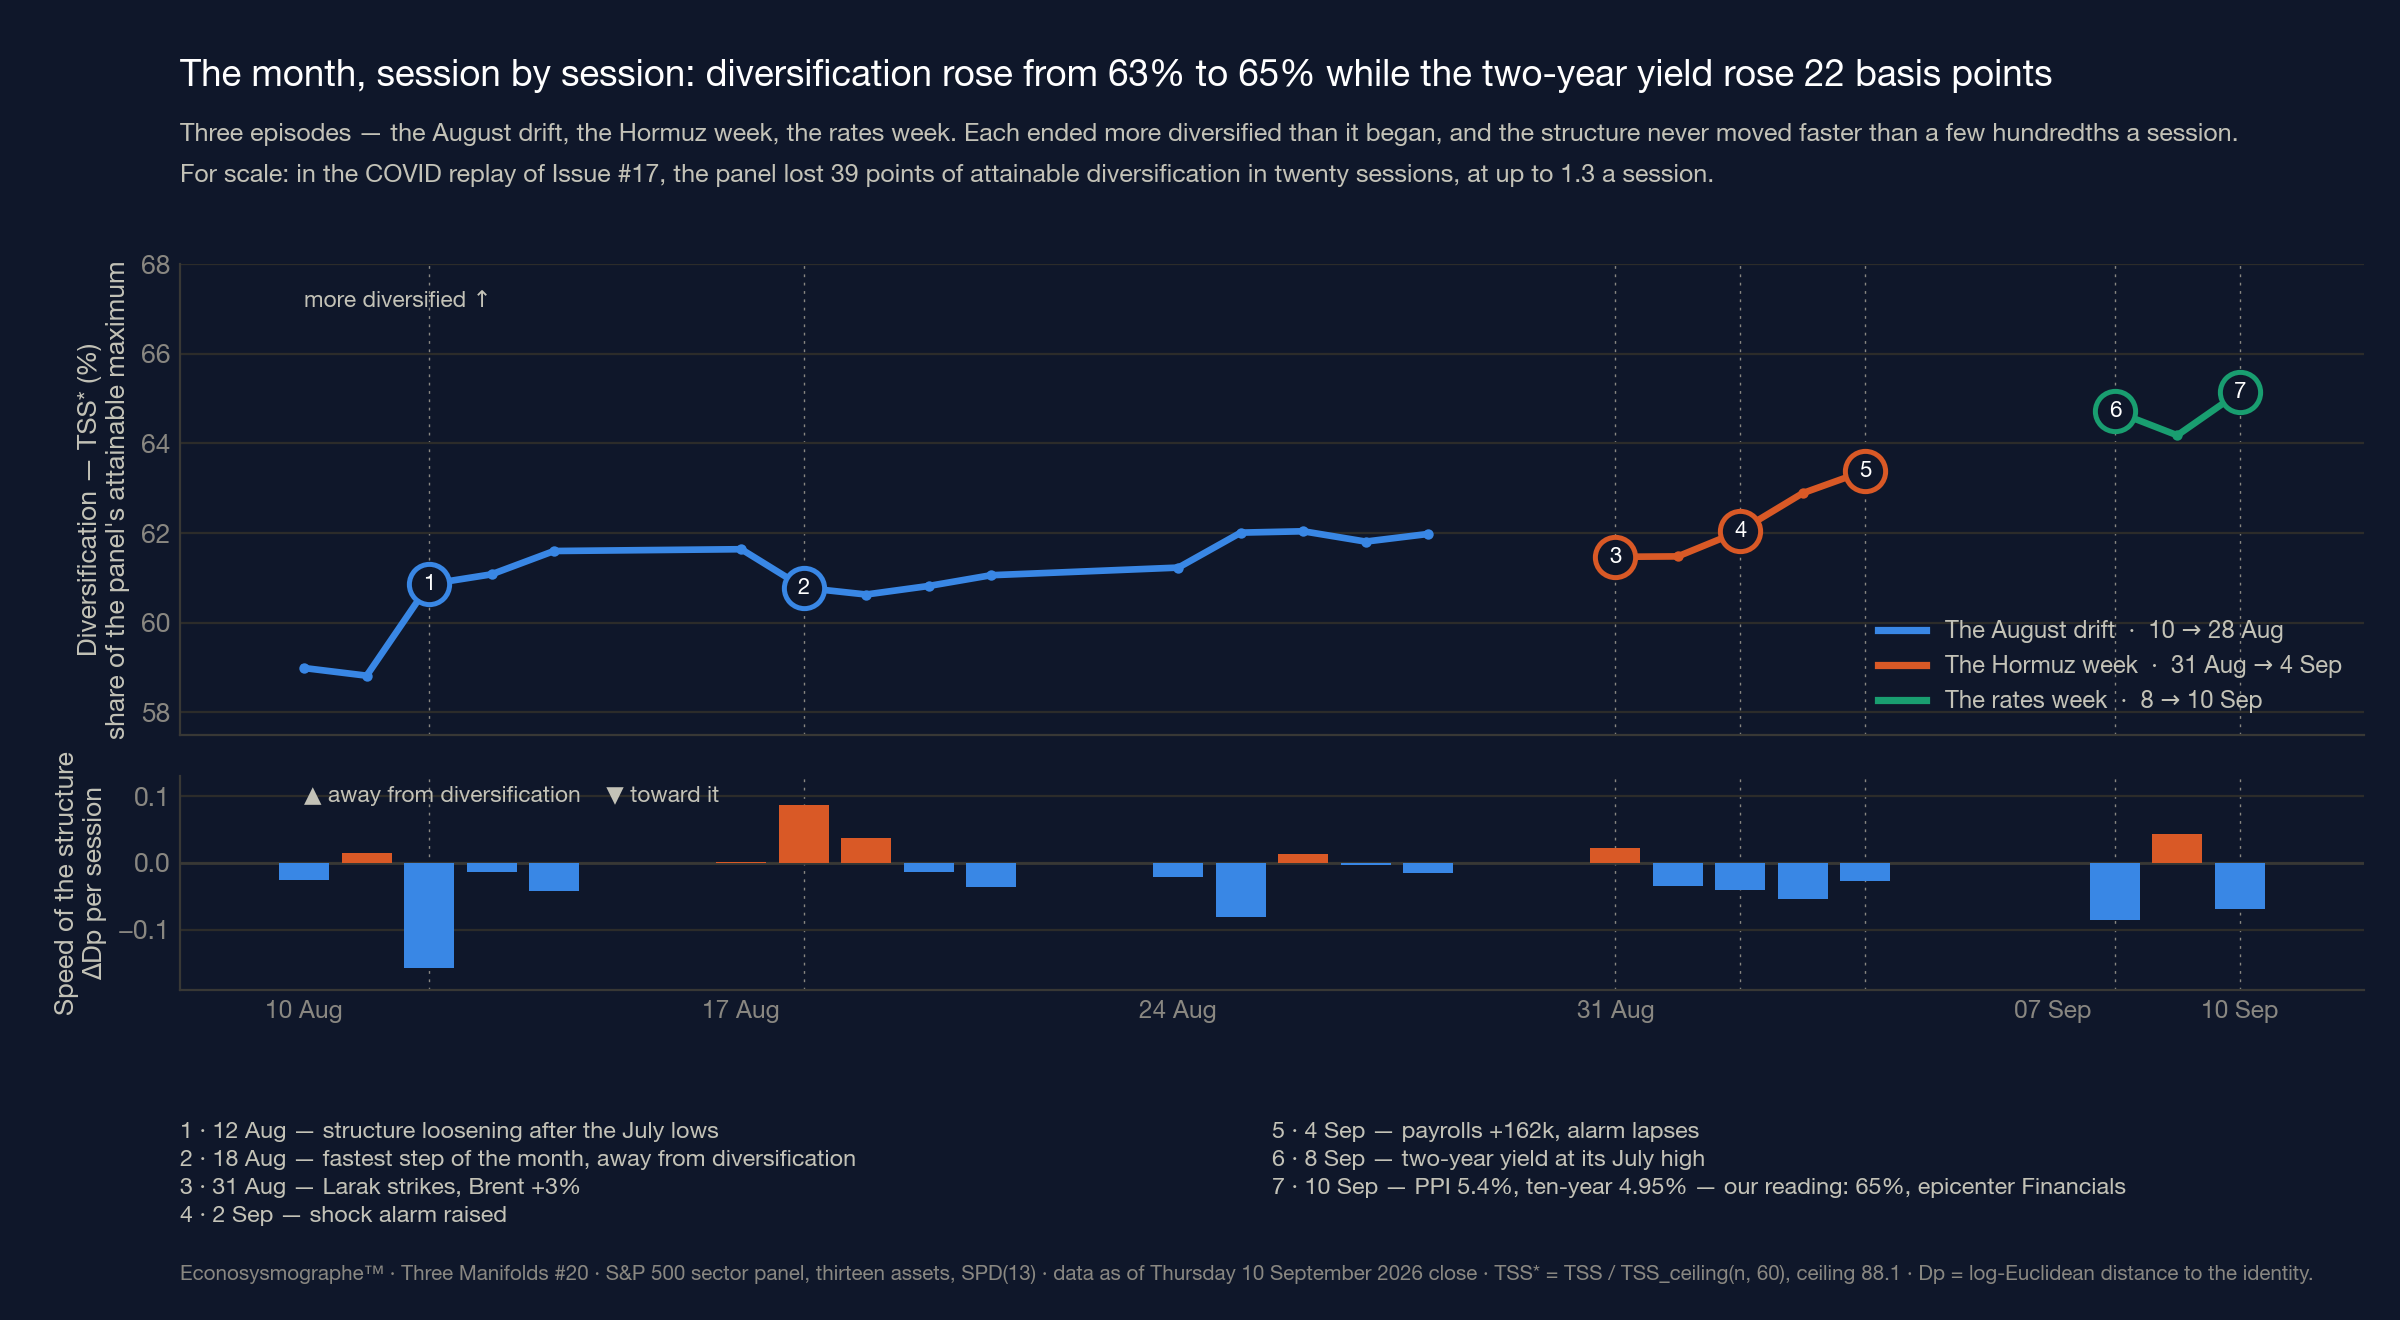
Under the panels. The shock alarm we raised two weeks ago went quiet after two sessions. The macro regime still reads Expansion, as it has since June. The structure absorbed a price shock, energy and money, without concentrating.
The price of capital has changed. The structure shows the financiers paying for it.
The week
What happened, in order — and where does our reading sit in it?
Brent climbed from $102 on 4 September to $109 at Wednesday’s settle. On Thursday morning producer prices came in 5.4% above a year ago. By the close the ten-year had reached 4.95%, up 18 basis points from 3 September. The two-year stood at 4.56%, up 22. That is where our reading is taken.
Oracle reported after that close: the figures in the opening line, and a promise to spend $90–95 billion this year. On Friday, core inflation printed 0.3%, a tenth above the consensus reported by CNBC; traders raised the odds of a hike on Wednesday, which CME FedWatch had put near 56% on Monday.
New York: Financials carry the stress
The question. Technology stands for growth, Financials for the balance sheet. Which one is carrying the week’s stress?
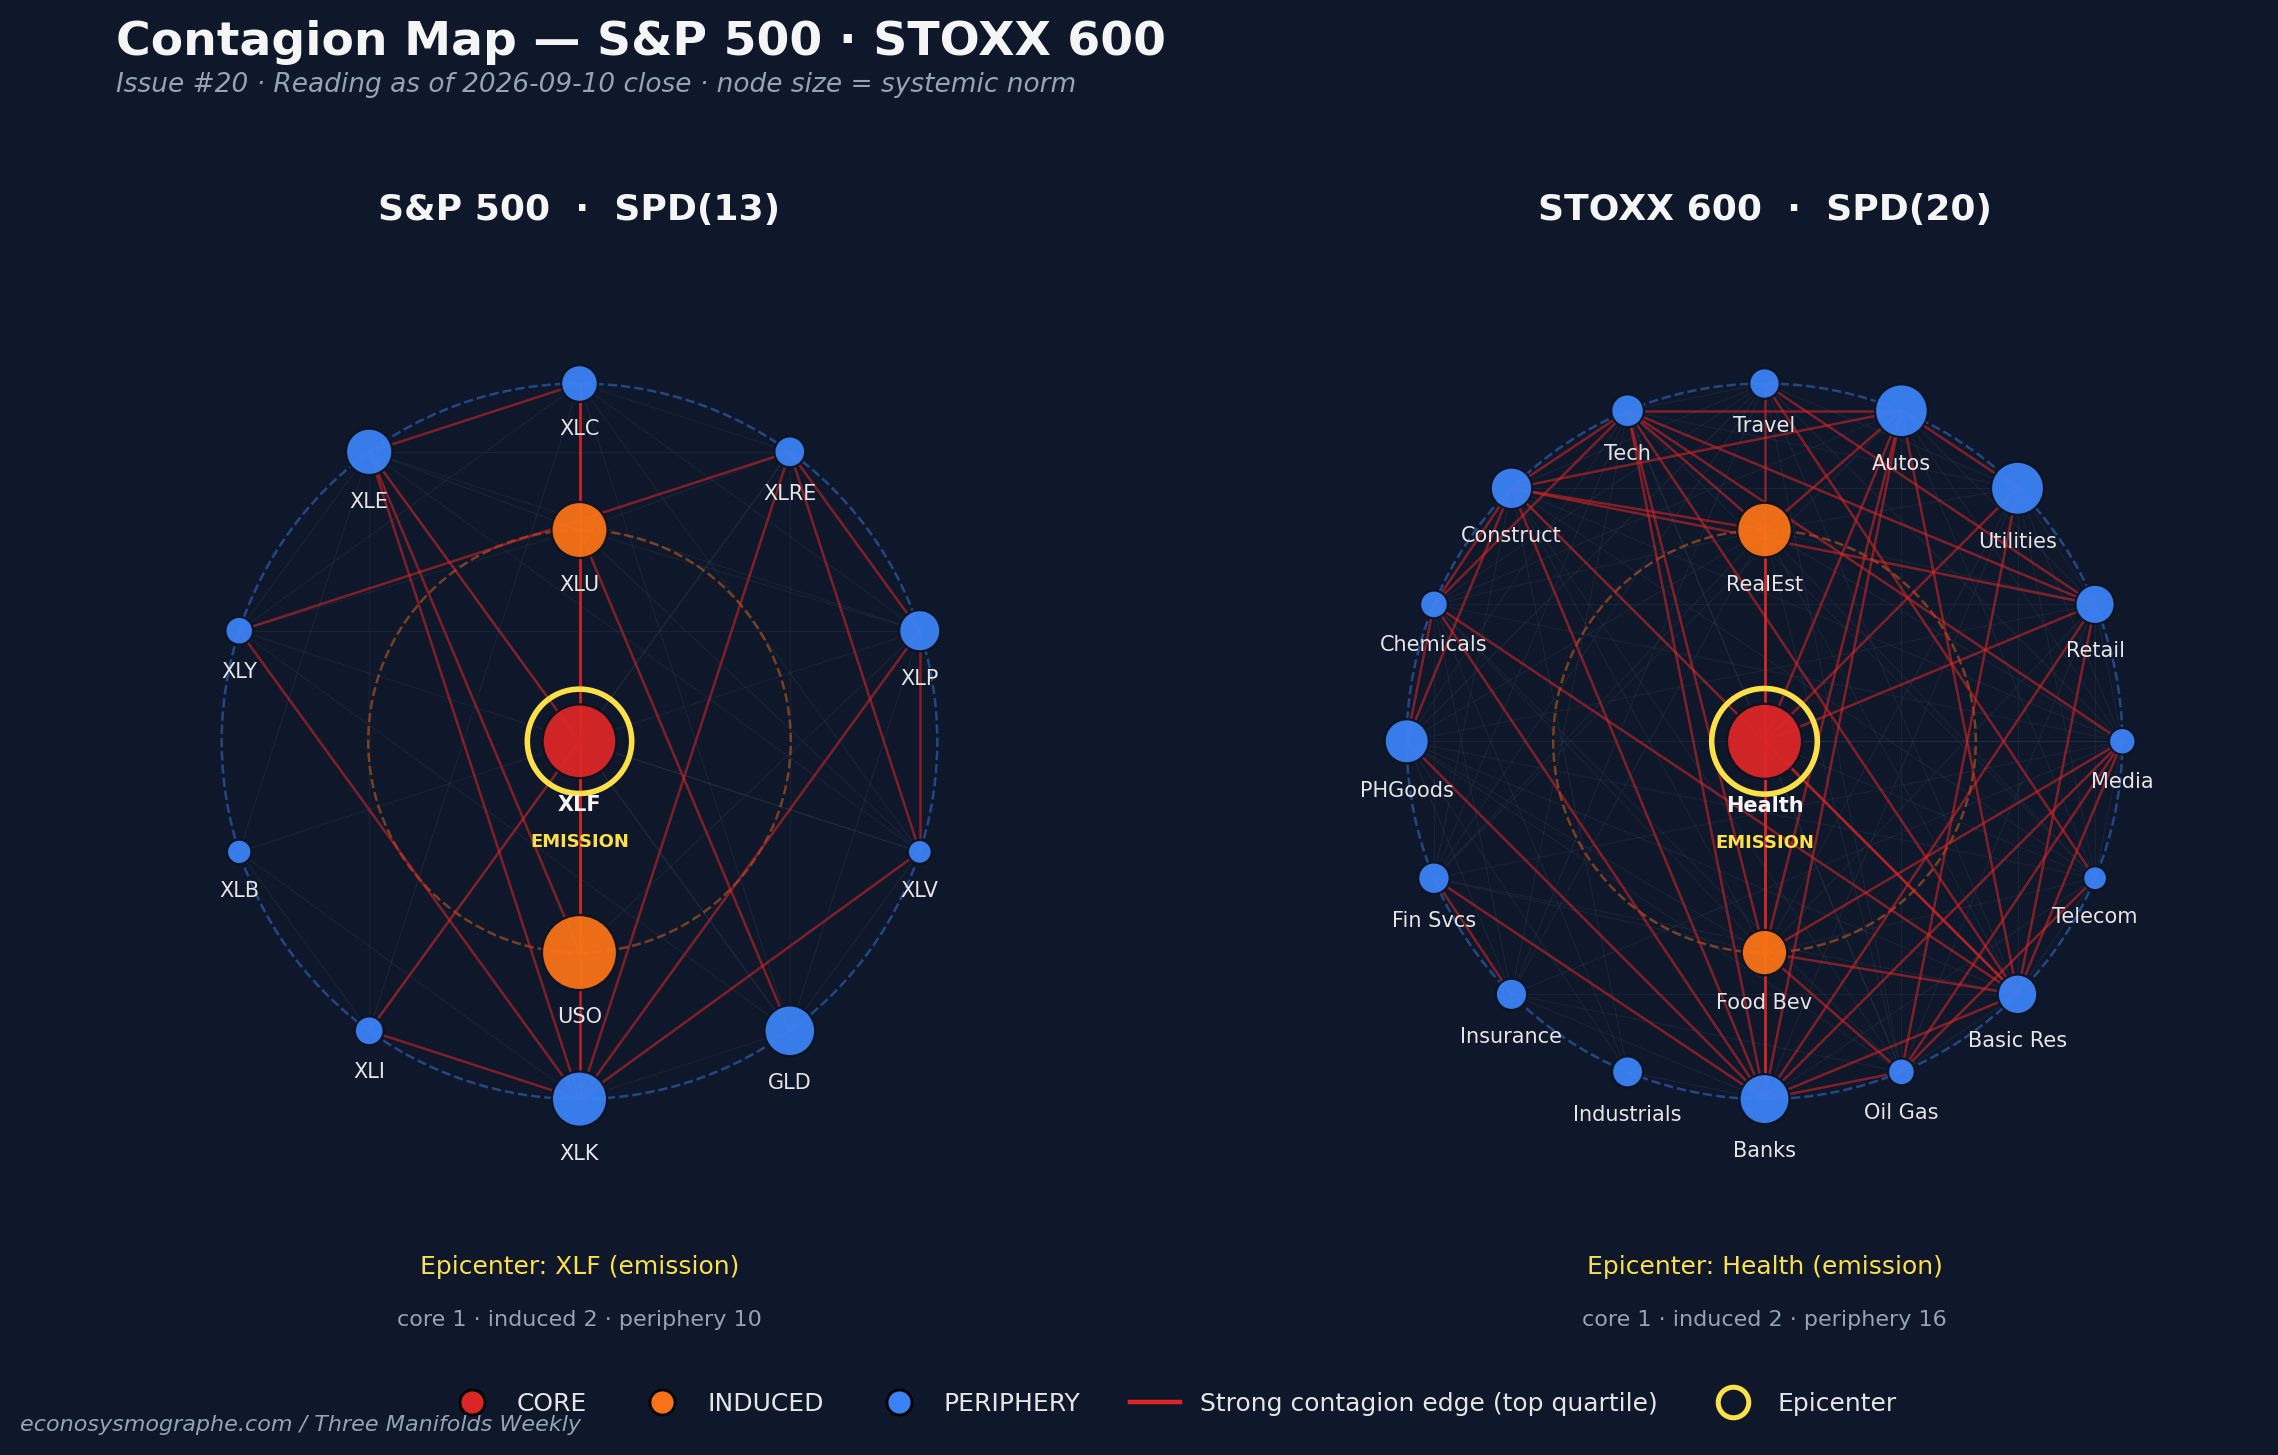
The geometric answer. Each week we measure how the thirteen assets of the S&P sector panel move together, and which one has drifted furthest from its own habit. On Thursday that was Financials, 2.1 standard deviations from its own history, with oil and Materials moving with it. It was the only sector on the panel outside its usual range.
A week earlier the epicenter was Industrials, in the same cyclical cluster. The channel held; the leader changed to the sector most sensitive to the two-year yield, in the week the two-year moved most. Technology neither led nor joined the cluster.
What it means. The stress did not follow the headline. It followed the financing. The panel’s diversification score even rose two points, to 57% raw — 65% of the ceiling this panel can attain, the scale used in the chart below: risk is spread a little more evenly than a week ago. Our composite stress gauge read 0.05, calm. A repricing, not a rupture.
Europe: from the builders to property
The question. Two weeks of headlines put Europe’s stress on Construction. Is that still where it sits?
The geometric answer. No. The epicenter left Construction and settled on Health, with Real Estate and Basic Resources alongside, in the week the Bund closed at 3.51%, up nine basis points.
What it means. The European transmitter moved from the builders to property and Health. Real Estate is the sector most sensitive to long-term yields; this week Health and Basic Resources moved with it. The panel’s stress is carried there, not by Construction.
The base: alarm off, regime unchanged
The question. The alarm we raised two weeks ago — the sell-off, the strikes, the Bund — did it turn into a regime change?
The geometric answer. No. Under the panels, the base tracks thirteen macro conditions as a state machine. The state has read Expansion since 12 June. The shock alarm needed five sessions to become the state. It lasted two, and went quiet on 4 September.
What it means. Since then every rates gauge has moved: the MOVE index at 82, back at its Hormuz-week peak, breakevens at 2.40%, the VIX from 14 to 18. None of it changed the regime.
Money itself remains available: investment-grade credit sits 80 basis points over Treasuries, and three-month commercial paper runs 8 basis points over bills. The stress is on the price of capital, not its supply. Wednesday arrives with a regime unchanged since June, an alarm that armed and stood down, and a rates market moving faster than either. The structure prices the rates; the regime holds.
Book a discovery session on your own exposure →
The audit: what held
Did we call it right? Three of last week’s four calls already have a direction. The shock alarm will not become a regime: it went quiet on 4 September, so that call has failed early. Europe’s construction sector will keep the epicenter: it has already lost it to Health. New York’s stress will stay in the cyclicals: it has — Financials, oil, Materials. The fourth, on how much of the technology panel’s stress comes from the macro layer, is read on Wednesday’s close.
The markers we posted a fortnight ago: Brent above $95, yes, at $109. Breakevens climbing, yes, 2.35% to 2.40%. Bond volatility elevated, yes, back at its peak. The size of the technology core zone can no longer be compared: we changed how zones are counted on 5 September, and the count restarts here.
Two markers we add this week, because the story is now the financing: the investment-grade credit spread, 80 basis points, flat on the week; and bank funding, three-month financial commercial paper over Treasury bills, 8 basis points. Both quiet. The structure has moved the stress onto the financiers while the price of their money has not moved.
For an allocator
What do you re-cost on Monday morning? Diagnostic, not prescriptive: exposures to re-cost, not positions to take.
Hedges sized on a technology drawdown are protecting against the sector that stayed inside its range. The structure says rates shock through Financials: the sector at the epicenter, oil and Materials in its cluster, the two-year up 22 basis points. Three sector bets, one channel.
The analysts graded the income statement; the balance sheet graded itself. Oracle beat, posted free cash flow of minus $5 billion, sold $20 billion of stock and will spend $90–95 billion this year at a ten-year of 4.95%. The demand is confirmed; the constraint is cash. On Thursday, the structure put the stress on the companies that finance the build-out, not on the ones that spend.
Europe’s stress is carried by property and Health, not the builders. Real Estate, the sector most sensitive to long-term yields, sits at the epicenter with Health and Basic Resources; Construction, last week’s transmitter, does not.
Pre-registered for Issue #21
What will you know next Sunday that you do not know today? Issue #21 is written after the Fed. It will say, whichever way they go:
- whether Financials still carried the New York epicenter at Wednesday’s close, or whether it moved to Technology after Oracle;
- whether Technology stayed inside its usual range on Friday’s and Wednesday’s readings, after the print — first read in Tuesday’s brief;
- whether Europe’s epicenter stayed on Health and property through the decision;
- whether the regime stays Expansion through 17 September, with no state change;
- whether the price of money stayed quiet while the structure did not: investment-grade spread below 100 basis points and commercial paper below 25 basis points over bills through Wednesday. Falsified if either trips.
Tuesday: the Tech brief on Friday’s data — Oracle’s quarter line by line, and what the structure did after the print.
- The platform → econosysmographe.com/platform · Methodology → econosysmographe.com/methodology · Glossary → econosysmographe.com/glossary · contact@econosysmographe.eu
Notation annex → The measures are experimental research metrics from the Universal Risk Framework (SSRN working papers), not market standards. The diversification score is the TSS: how evenly risk is spread across the directions of a panel’s correlation structure (100% = evenly spread; low = concentrated); its zones are Singularity, Tension and Isotropic, on the dimension-normalised TSS* with thresholds at 50 and 80. The composite stress gauge is the Stress composite (0–1), the co-tension of four geometric measures of the panel, built the way the ECB builds its CISS; calm below 0.30, high above 0.34; it measures stress in progress and does not precede a first shock. The epicenter (the transmission root of earlier issues) is the direction of co-movement reading furthest from its own history, in standard deviations, named only when it reads outside its usual range (1.64 or more); core / induced / periphery rank that reading among the directions the panel can resolve. Readings are taken on the last settled session, Thursday; Friday’s session is read in Tuesday’s brief. Full methodology at econosysmographe.com/methodology.
Sources. BLS, Producer Price Index — August 2026 (10 Sept) and Consumer Price Index — August 2026 (11 Sept). FRED: DGS10, DGS2, T10YIE (Thursday 10 September closes; weekly changes from Thursday 3 September), DCOILBRENTEU (4 September and Wednesday 9 September settles), VIXCLS, BAMLC0A0CM (ICE BofA US corporate OAS), DCPF3M and DTB3 (3-month AA financial commercial paper and 3-month bill). Bund 10-year and the MOVE index: Base V3 inputs (EODHD; ECB Data Portal), Thursday closes — terminal tickers GDBR10, MOVE. Core CPI consensus and the traders’ reaction: CNBC, 11 September. Oracle, first-quarter fiscal 2027 results and earnings call (10 Sept). Fed hike probability: CME FedWatch as reported by Yahoo Finance, 8 September. Econosysmographe: Global Systemic Composite SPD(89), S&P 500 SPD(13), STOXX 600 SPD(20), Base V3; Tech Manifold Live SPD(99). Manifold data as of Thursday 10 September 2026 close. Raw payloads on request.
Disclaimer & Regulatory Status. This document is published for sophisticated, professional, and institutional readers for informational and educational purposes only. It does not constitute investment research within the meaning of regulatory frameworks, nor is it an offer, solicitation, or recommendation to buy or sell any financial instrument. SmartGreenInvest Ltd (Reg. England & Wales No. 14636473) is not an FCA-regulated firm. All analyses are based on public quantitative data and geometric modeling as of the date of publication. Opinions expressed are subject to change without notice. Historical performance and model readings are not indicative of future results. SmartGreenInvest Ltd holds no positions in the issuers named. The author is a self-directed, long-term buy-and-hold investor in US technology equities, at a scale immaterial to the market capitalisations discussed.
By Evangelos Papadopoulos · Independent Researcher · econosysmographe.com