The Fed Raised Rates to 3.75%–4.00%. Stocks Held. The Fast Regime Changed.
The Federal Reserve raised its policy rate on Wednesday to a range of 3.75% to 4.00%, its first increase since July 2023, and the S&P 500 ended the week 0.1% lower. The equity structure we measure barely moved, and in New York as in Europe the direction that leads the sector panel reads inside its usual range. What did change is underneath: on Thursday 17 September the fast layer of our macro state, which sorts thirteen conditions such as real yields, the two yield curves, volatility and the dollar into named regimes, moved from Expansion to Shock, its first change since 12 June, while the business cycle still reads Expansion. It changed on the day the S&P 500 had its best session since 4 August, because that state responds to the speed of macro conditions and not to their direction.
Manifold data as of Thursday 17 September 2026 close · Market data through Friday 18 September · 6 min read
The reading in 30 seconds
The rise in rates did not concentrate equity risk. The S&P sector panel was a little more diversified on Thursday than a week earlier, and our composite stress gauge read 0.03 on a scale where anything below 0.30 is calm.
Last week’s reading on Financials turned out to be a flare. The sector read 2.1 standard deviations from its own history on Thursday 10 September and 2.6 on Monday 14 September, and was back inside its range the next session both times.
The macro regime is the news, in its fast layer only, and Shock here names the speed at which rates conditions move, not a break in credit or in funding. The shock alarm we described last week as having stood down re-armed on Friday 11 September, held for the five sessions the state requires, and became the state itself on Thursday 17 September.
The week
The Federal Open Market Committee voted 12 to 0 on Wednesday 16 September to raise the federal funds rate by a quarter point, to 3.75%–4.00%, and its new projections put the median rate at 4.1% at the end of 2026, against 3.8% in June. On Wednesday the S&P 500 closed 0.4% lower at 7,551.81. The ten-year Treasury yield closed at 5.01%, from 4.95% a week earlier.
Thursday reversed it. Treasuries rallied, the ten-year fell back to 4.94% and the two-year to 4.67% from 4.74%, and the S&P 500 rose 1.1%, its best session since 4 August. On Friday, a quarterly expiry, the index added 0.2% to 7,650.50, which left it 0.1% lower on the week.
The week held a paradox for anyone who expects higher rates to help banks. The prime rate rose to 7.00% from 6.75% on Thursday, on the Federal Reserve’s series, and the largest banks ended the week 4.8 points behind the index, their worst week against it since mid-May and a gap in the lowest 1% of the past two years. The front-month Brent financial future on NYMEX, which settles against the ICE benchmark, closed at $99.93 on Thursday and slipped to $98.77 on Friday, 3.3% lower over five sessions and back under $100 after trading near $104 on Tuesday.
New York: the leading direction stays inside its range
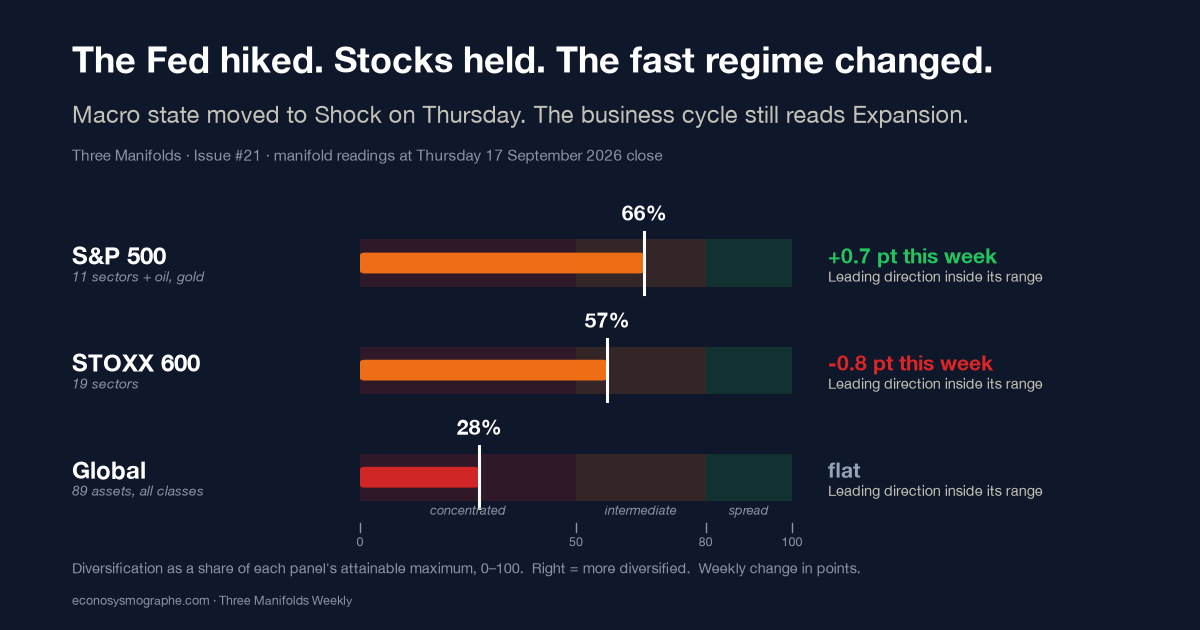
Each week we measure how the thirteen assets of the S&P sector panel move together. Among the directions of co-movement the panel can resolve, one leads, and we call it an epicenter only when it reads more than 1.64 standard deviations from its own history. On Thursday it did not: the leading direction, one that groups gold, Utilities and Consumer Discretionary, read 0.85.
The panel’s diversification score, which counts how evenly risk is spread across the panel’s directions, stood at 58.0% on Thursday, or 65.8% of the ceiling a thirteen-asset panel can attain, against 65.1% on 10 September. The structure moved toward diversification on Fed day and the day after, and the composite stress gauge fell from 0.05 to 0.03.
Europe: the lead stays on property and Health Care
In Europe the leading direction was Real Estate on Fed day and Health Care on Thursday, the two sectors we named last week, but at 0.17 and 0.93 standard deviations both sat well inside their range. The European panel’s diversification slipped from 58.0% to 57.2% of its ceiling.
Under the panels: the regime changed on Thursday
The alarm we called quiet last Sunday re-armed on Friday 11 September, the day after our reading, and this time it held through Monday, Tuesday, Fed day and Thursday, the five consecutive sessions our rule requires before an alarm becomes the state. On Thursday 17 September the fast layer left Expansion, where it had been since 12 June, for the state we call Shock, which is defined by how fast conditions move. The slow layer did not move: the OECD’s leading indicator stands at 100.89, up from 100.80 a month earlier, and the business cycle has read Expansion since February.
The speed came from rates in two currencies. The real ten-year Treasury yield rose from 2.55% to 2.68% by Fed day, the gap between ten-year and two-year Treasury yields narrowed from 0.39 to 0.27 percentage points between 10 and 17 September, and the same gap in Germany narrowed from 0.47 to 0.34, while the ten-year Bund rose from 3.51% to 3.58%. Volatility did not join in: the VIX fell from 17.8 to 15.4. The word Shock names that fast repricing of rates in two currencies, and nothing that broke.
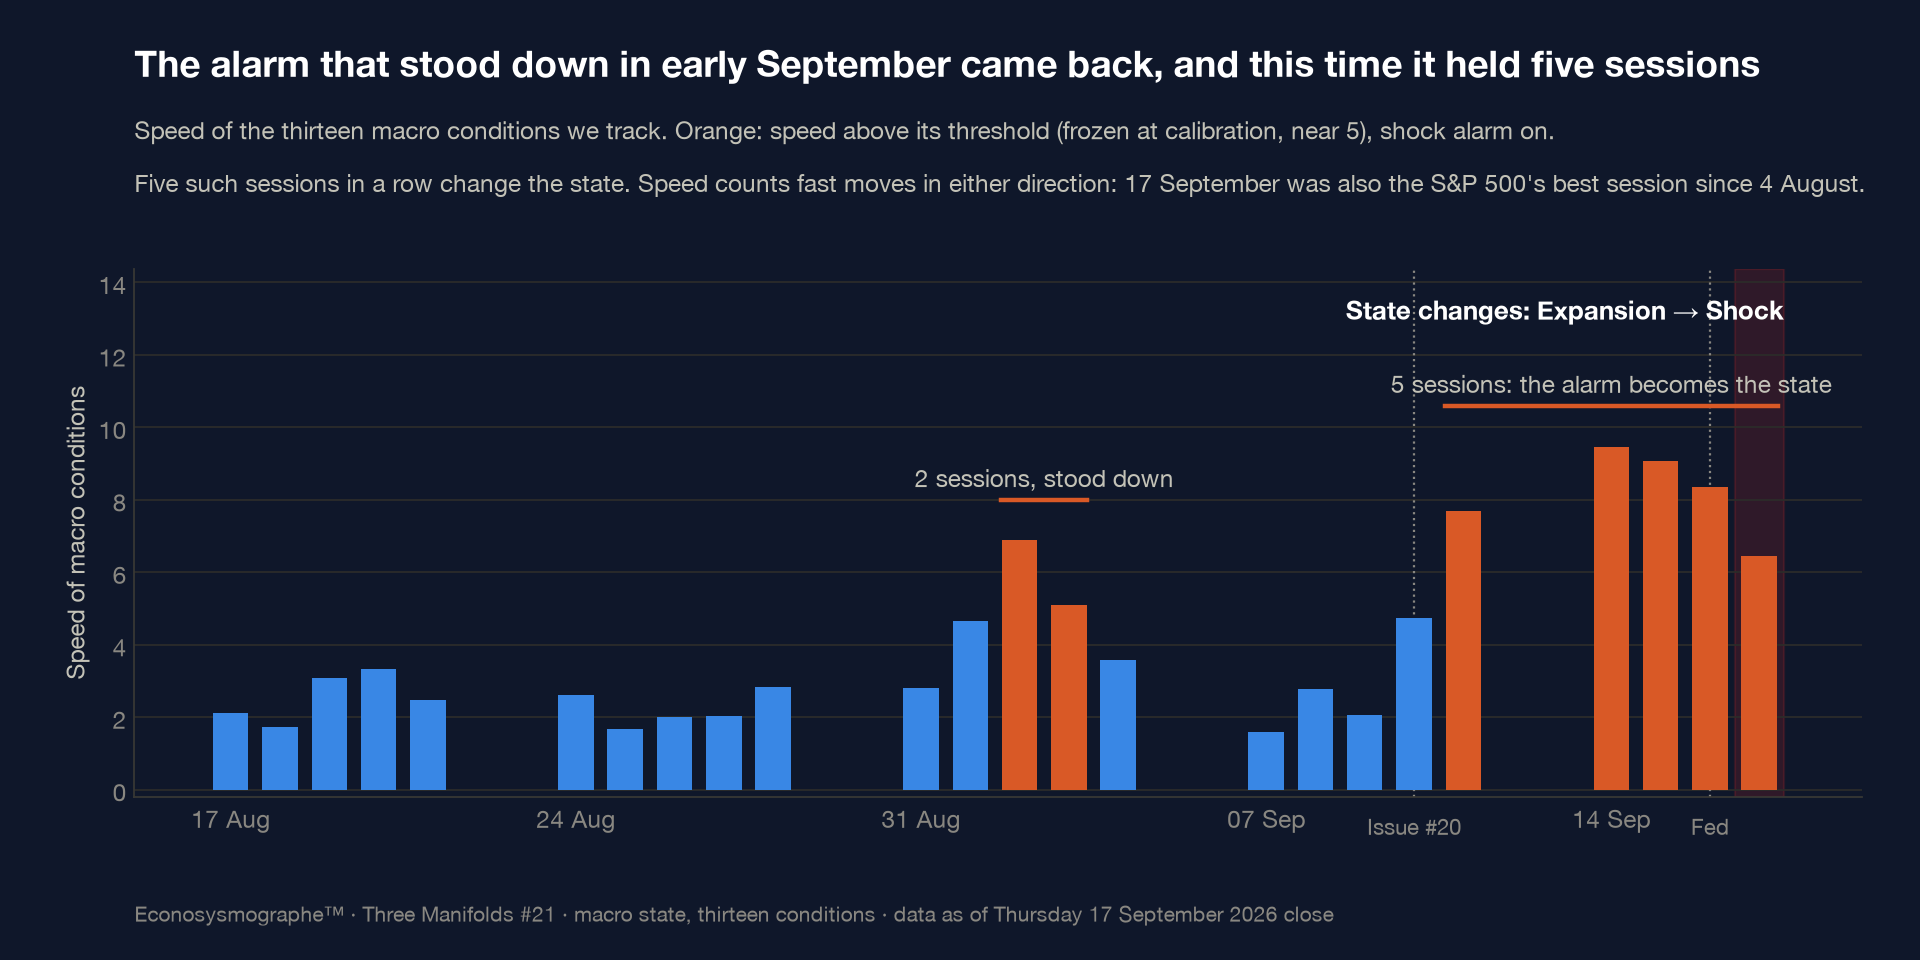
Shock is a state of passage. In the state’s record, computed from January 2014 to 17 September 2026, two of its thirty-five completed episodes returned directly to Expansion, and the five since December 2023 lasted between three and ten weeks.
Book a discovery session on your own exposure →
The audit: two of five did not hold
Financials did not keep the New York epicenter. The reading fell from 2.1 standard deviations on 10 September to 0.7 the next day, flared to 2.6 on Monday 14 and was back at 0.4 on Tuesday. That Monday the oil fund in the panel rose 1.1%, the financial sector fund fell 0.4%, in line with the index, and the Materials fund fell 0.9%. The direction groups all three, and none of them moved enough that day to account for the reading alone. On Fed day the panel was led by its first, market-wide direction at 0.6, the Financials direction read zero, and the stress had not moved to Technology, the alternative we had named.
Technology stayed inside its range, at 0.4 on Friday 11 September and 0.6 on Fed day.
Europe’s lead stayed on property and Health Care through the decision, inside its range.
The regime did not stay Expansion through 17 September. The fast layer held Expansion through Wednesday 16 September and changed on Thursday 17, the last day of the window we had set.
Credit and short-term funding stress stayed quiet, with one leg we could not read. The investment-grade spread on the ICE BofA index held between 78 and 80 basis points, below the 100 we had set. The three-month rate on AA financial commercial paper, the series we had named, went unpublished from 14 to 17 September in the Federal Reserve’s release, which prints a rate only when enough paper is issued, and the AA series that did print stayed 4 to 19 basis points over bills, under our threshold of 25.
For an allocator
What follows is diagnostic and not prescriptive.
The diversification data did not signal the collapse that would strengthen the case for defensive hedging: the sector structure became more diversified over the week.
Last week’s reading on Financials was a flare and not a level, above two standard deviations on two separate sessions and gone the next day each time. Prices told a longer story. The financial sector fund lost 2.4% on the week against 0.1% for the index and did not join Thursday’s rally, and the move belonged to the largest banks, while regional banks had an ordinary week.
The change of regime points at the shape of the curve and not at its level. Both the Treasury and the Bund curves flattened by more than a tenth of a percentage point in a week while volatility fell. The exposures most sensitive to this reading are those whose economics depend on the gap between short- and long-term rates in either currency.
Before Issue #22
Issue #22 reads Thursday 24 September. It will say, whichever way they go:
- whether the macro state is still Shock on Thursday 24 September and, if it has left, for which state.
- whether any sector leads the New York panel outside its usual range.
- whether the European lead stays with Health Care and property for a third week.
- whether the New York panel stays above 65% of its attainable diversification.
- whether credit stays quiet, with the investment-grade spread below 100 basis points through Wednesday 23 September, and whether the three-month AA financial commercial paper rate is published again. That reading is falsified if the spread rises above 100 basis points.
The ten-year Treasury yield closed at 5.01% on Friday on the Treasury’s daily curve, back where it stood on Fed day, with the two-year at 4.76%, and the United Nations General Assembly opens its general debate in New York on Tuesday 22 September.
- The platform → econosysmographe.com/platform · Methodology → econosysmographe.com/methodology · Glossary → econosysmographe.com/glossary · contact@econosysmographe.eu
Notation annex → The measures are experimental research metrics from the Universal Risk Framework (SSRN working papers), not market standards. The diversification score is the TSS: how evenly risk is spread across the directions of a panel’s correlation structure (100% = evenly spread; low = concentrated); its zones are Singularity, Tension and Isotropic, on the dimension-normalised TSS* with thresholds at 50 and 80. The composite stress gauge is the Stress composite (0–1), the co-tension of four geometric measures of the panel, built the way the ECB builds its CISS; calm below 0.30, high above 0.34; it measures stress in progress and does not precede a first shock. The epicenter is the leading direction of co-movement among those the panel can resolve, read in standard deviations from its own history and named only when it reads outside its usual range (1.64 or more); core / induced / periphery rank the resolvable directions. The macro state has two layers: a slow one, the business-cycle phase read from the OECD composite leading indicator, and a fast one that sorts thirteen macro conditions into named regimes and overrides the slow one when conditions move quickly; the Shock state is entered after five consecutive sessions in which the speed of those conditions exceeds its threshold, whatever their direction. Readings are taken on the last settled session, Thursday; Friday’s session is read in Tuesday’s brief. Full methodology at econosysmographe.com/methodology.
Sources. Federal Reserve: FOMC statement of 16 September 2026 (vote and target range), Summary of Economic Projections (median federal funds rate, September and June), Commercial Paper Rates release (data as of 17 Sept). U.S. Treasury, Daily Treasury Par Yield Curve Rates, 16 to 18 September. FRED: SP500, DGS10, DGS2, DFII10 (ten-year real yield), VIXCLS, BAMLC0A0CM (ICE BofA US corporate OAS), DCPF3M and DTB3, closes of 10 to 17 September. Exchange closing prices, 11 to 18 September and two years of history: S&P 500, the financial sector (XLF), large bank (KBWB) and regional bank (KRE) funds, and the oil (USO) and Materials (XLB) funds of the panel. FRED DPRIME (bank prime loan rate). Brent: NYMEX Brent Last Day Financial future (BZ, cash-settled against the ICE Brent settlement), settlement of 17 Sept, last trade of 18 Sept and five-session change. United Nations, provisional schedule of the 81st session of the General Assembly. German ten-year and two-year benchmark yields, closes of 10 and 17 September. OECD, Composite Leading Indicator (September 2026 release). Econosysmographe: Global Systemic Composite SPD(89), S&P 500 SPD(13), STOXX 600 SPD(20), Base V3. Manifold data as of Thursday 17 September 2026 close. Raw payloads on request.
Disclaimer & Regulatory Status. This document is published for sophisticated, professional, and institutional readers for informational and educational purposes only. It does not constitute investment research within the meaning of regulatory frameworks, nor is it an offer, solicitation, or recommendation to buy or sell any financial instrument. SmartGreenInvest Ltd (Reg. England & Wales No. 14636473) is not an FCA-regulated firm. All analyses are based on public quantitative data and geometric modeling as of the date of publication. Opinions expressed are subject to change without notice. Historical performance and model readings are not indicative of future results. SmartGreenInvest Ltd holds no positions in the issuers named. The author is a self-directed, long-term buy-and-hold investor in US technology equities, at a scale immaterial to the market capitalisations discussed.
By Evangelos Papadopoulos · Independent Researcher · econosysmographe.com