Cybersecurity Rose 21% and Moved as One
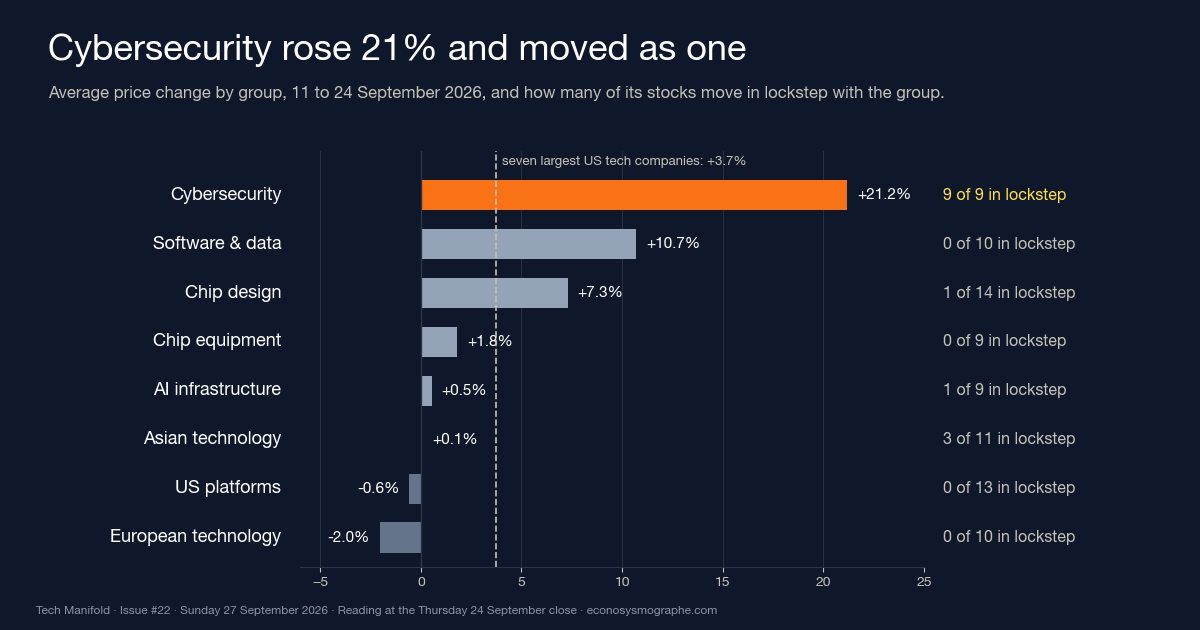
Nine cybersecurity stocks rose an average 21% between 11 and 24 September, against 3.7% for the seven largest US technology companies, and by Thursday all nine were moving in lockstep. Our Tech Manifold has shown that reading for one group alone only once in two years. It came with a rotation inside technology that the market half reversed within a week: the chipmakers were bought back, the power producers were not. On Friday, after our reading, all nine security stocks fell together.
Tech Manifold · Premium Issue · Issue #22 · Sunday 27 September 2026 · Manifold data as of Thursday 24 September 2026 close · Market data through Friday 25 September · 7 min read
The reading in 30 seconds
On Thursday every one of the nine cybersecurity stocks we follow was more tightly bound to the other eight than on nine days in ten of its own history, after the group gained 21% between 11 and 24 September. Nine names now behave, for a portfolio, close to one position.
The move began on Monday 14 September, when the security stocks jumped while the chipmakers, the AI infrastructure names and the power producers fell. By Thursday the chips had recovered, while the two power producers and Oracle, three balance-sheet-intensive parts of the AI build-out, had not.
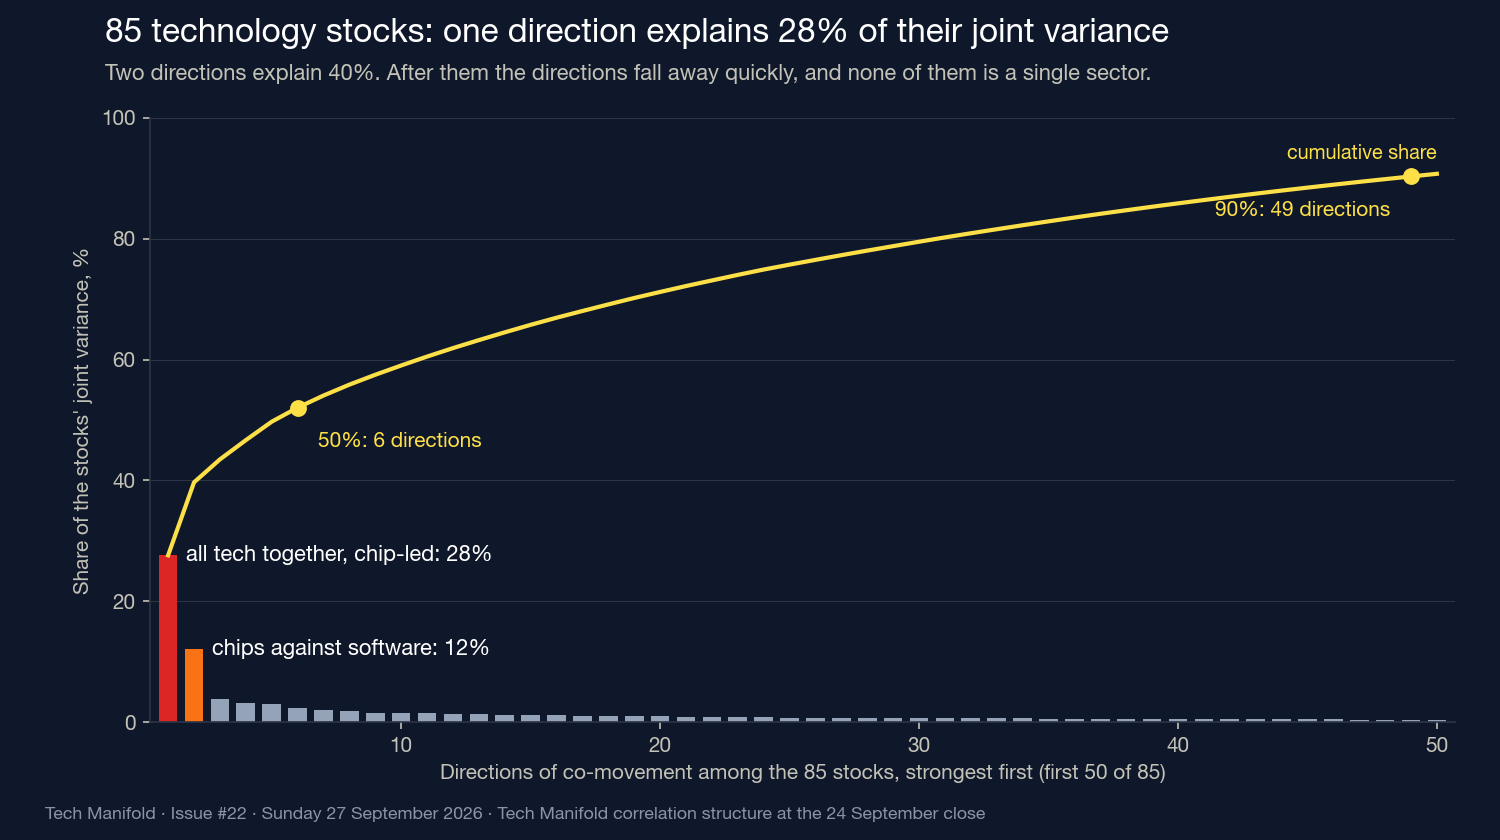
Underneath, the sector’s structure held: one common direction still explains 28% of the joint variance of the 85 stocks, and the second, 12%, is precisely the axis the market traded on 14 September, chips against software.
The week
Rates carried the week. On the Treasury’s daily par curve the ten-year yield rose from 4.96% on Tuesday to 5.11% on Wednesday, a 15-basis-point rise, and closed at 5.18% on Thursday, its highest close of the year and its fifth close above 5% in 2026, all of them in September. The long end went further: the thirty-year closed at 5.47% and the twenty-year at 5.53%, both highs for the year, and the five-year crossed 5% for the first time in 2026. The ICE BofA MOVE index of Treasury volatility rose from 78.6 to 104.6 over the same sessions, a three-month high, while the Cboe VIX rose from 14.21 to 15.67, well below the 20.66 it reached on 29 July.
In an essay titled “We Must Pace the Frontier”, published in September on his own site, Anthropic’s chief executive Dario Amodei called for a slower pace of AI development, citing among its risks the “misuse of AI for cyberattacks”. The essay does not discuss markets. On Monday 14 September, the first session after it appeared, the S&P 500 fell 0.5% while the nine cybersecurity stocks gained 12.8% on average, every one of them between 5% and 17%.
On Friday, after our Thursday reading, the S&P 500 rose 0.5% to 7,743.41 and the thirty-year Treasury yield closed at 5.49%, another high for the year, while all nine cybersecurity stocks fell, by between 2.9% and 10.1%, an average of 5.0%. Our reading does not contain that session.
First, the audit: three of five held
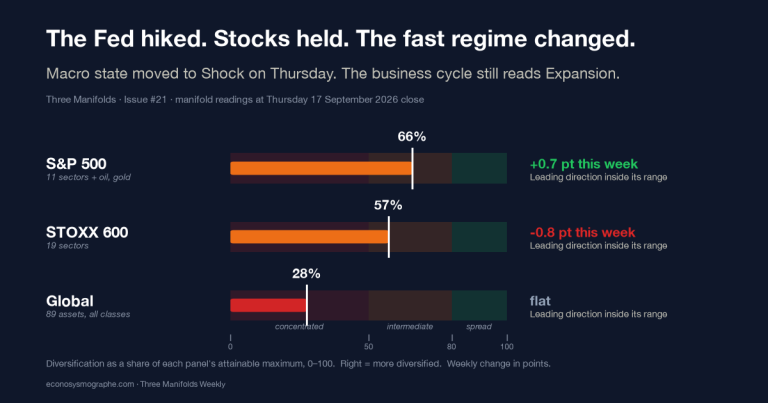
The macro state, which sorts thirteen conditions such as real yields, volatility and the dollar into named regimes, is still Shock. No sector led the New York panel outside its usual range. Europe’s lead did not stay with Health Care and property, moving on Thursday to Media and Basic Resources. The New York panel did not stay above 65% of its attainable diversification throughout, reading 64.8% on Wednesday. Credit stayed quiet, with the investment-grade spread between 77 and 79 basis points and the three-month AA financial commercial paper rate published again on 21 September.
Eight groups, and one in lockstep
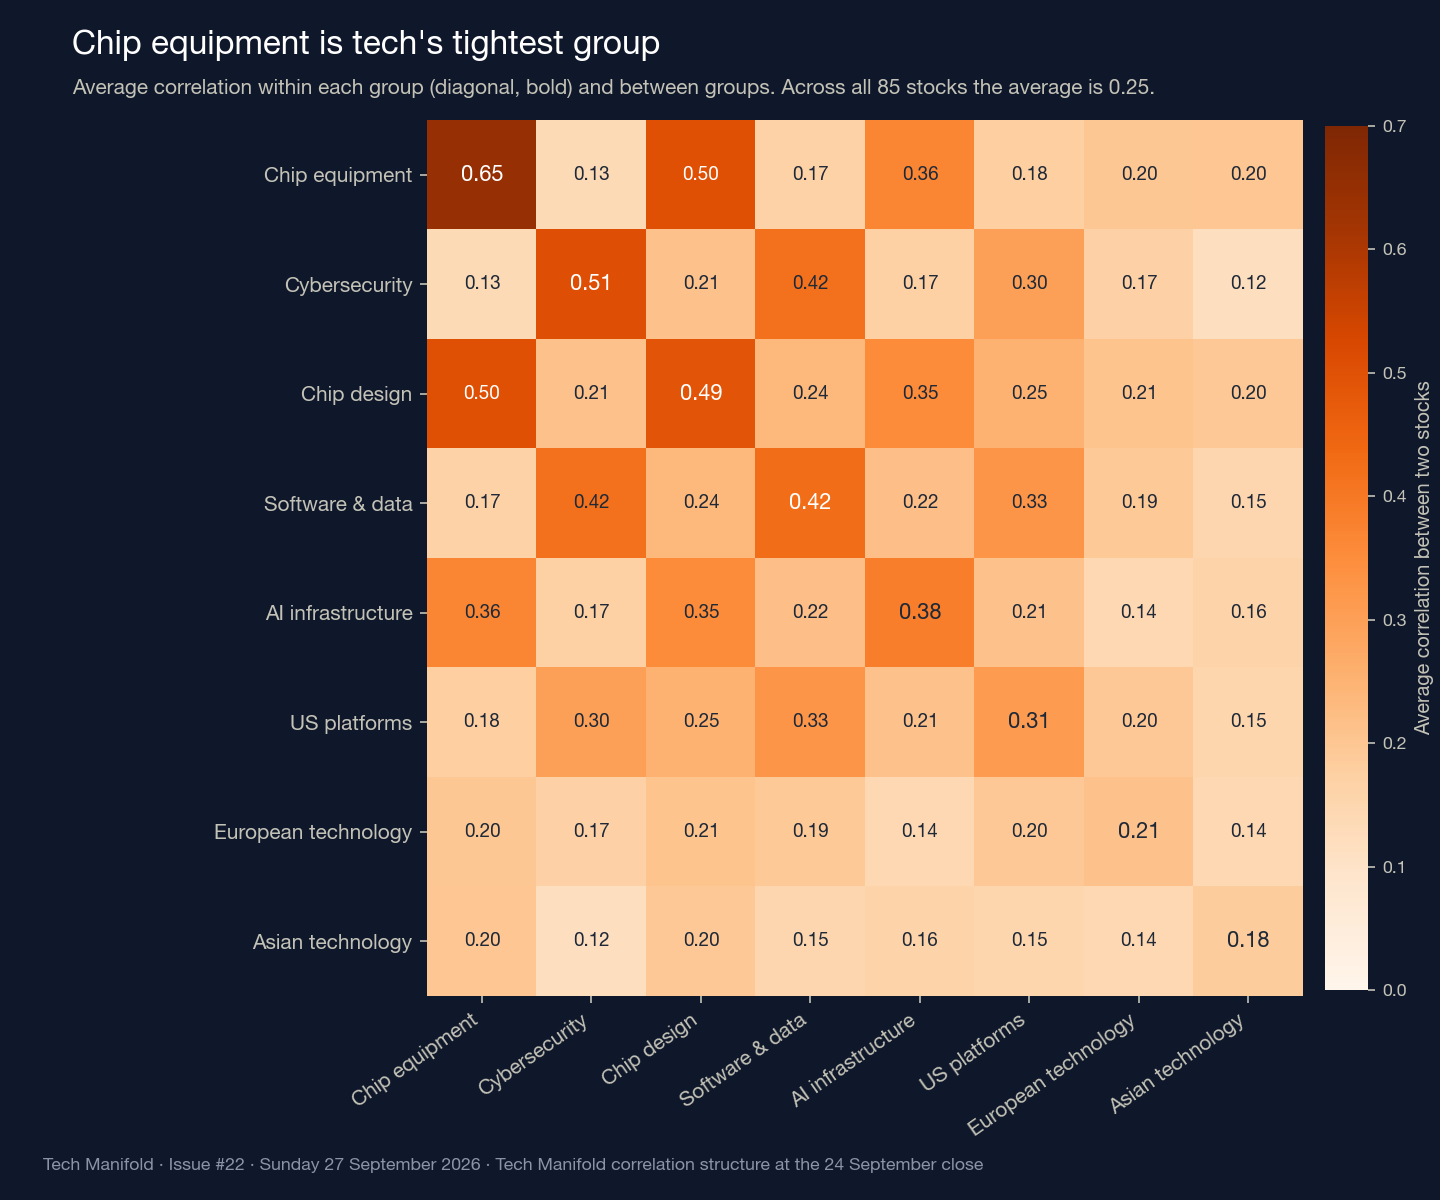
The Tech Manifold follows 85 technology stocks in eight groups, read each week together with fourteen macro series such as rates, the dollar and the VIX. A stock is in lockstep with its group when it is more tightly bound to the group’s other stocks than on nine days in ten of its own history, measured on the shape of the group’s correlations over sixty sessions. The reading has no direction: a group can be in lockstep while it rises or while it falls.
| Group | Stocks | Average correlation between members | In lockstep on Thursday | Price change, 11 → 24 Sept |
|---|---|---|---|---|
| Cybersecurity | 9 | 0.51 | 9 of 9 | +21.2% |
| Software & data | 10 | 0.42 | 0 | +10.7% |
| Chip design | 14 | 0.49 | 1 | +7.3% |
| Chip equipment | 9 | 0.65 | 0 | +1.8% |
| AI infrastructure | 9 | 0.38 | 1 | +0.5% |
| Asian technology | 11 | 0.18 | 3 | +0.1% |
| US platforms | 13 | 0.31 | 0 | −0.6% |
| European technology | 10 | 0.21 | 0 | −2.0% |
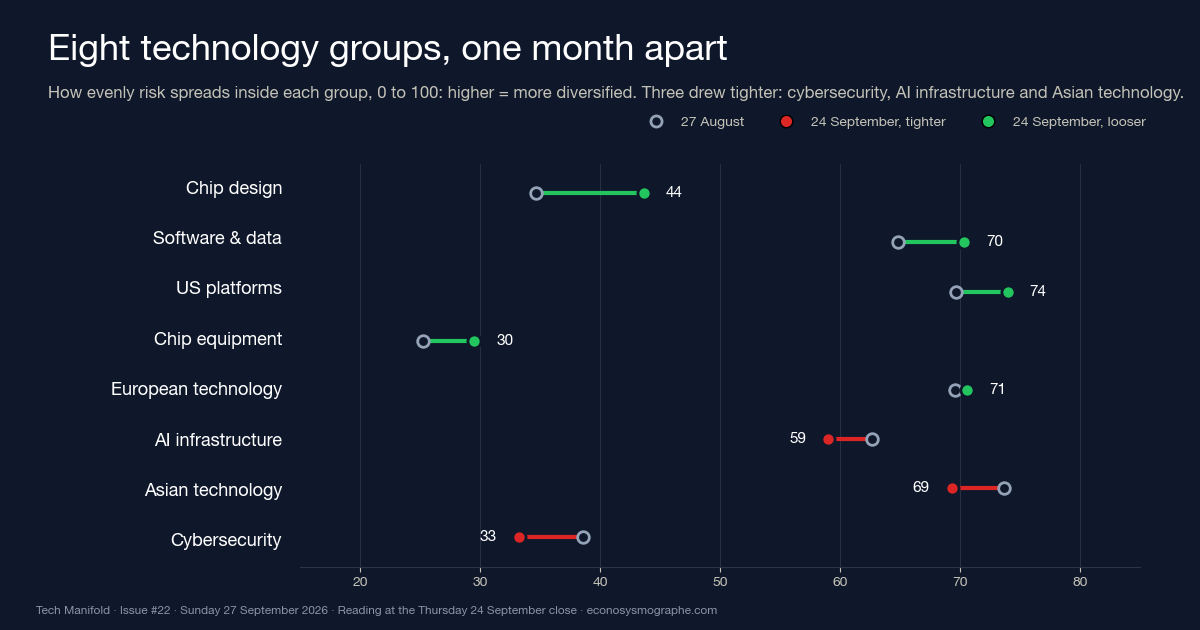
The full cybersecurity group has been in lockstep since Monday 14 September, nine sessions. The only earlier episode in two years ran from 18 April to 23 May 2025, after the tariff shock, when software, the US platforms and later European technology were in lockstep as well. This time cybersecurity is alone, and the average thirty-session correlation between its members rose from 0.63 on 27 August to 0.75 on Thursday.
Seen from outside, the same group now diversifies the rest of the sector. Over the last thirty sessions its average daily move correlated at minus 0.19 with the chip-equipment makers and minus 0.12 with AI infrastructure, and at 0.23 with the other 76 technology stocks, against 0.55 over two years. Only software still moves with it, at 0.77.
Want the full detail, stock by stock? Order the detailed report →
The rotation of 14 September, and what the market bought back
On the day of the jump, the chip-equipment makers fell 7.9% on average, the AI infrastructure group 5.6% and the chip designers 4.8%, while the seven largest US technology companies were flat. A week later the picture had split. From 17 to 24 September the chip designers rose 8.4% and the equipment makers 8.1%, and two AI cloud providers regained double digits.
What the market did not buy back were several balance-sheet-intensive parts of the build-out. Constellation Energy and Vistra, the two power producers in our AI infrastructure group, were down 8.1% and 7.0% between 11 and 24 September, and Oracle 7.1%. In its chief financial officer’s commentary for the quarter to late July, filed with the Securities and Exchange Commission, Nvidia reported that the average time to collect its receivables rose to 60 days from 45, “due to extended payment terms on large, multi-quarter agreements with certain investment-grade customers”, and described arrangements that help customers secure land, power and data-centre capacity. Oracle raised $19.9 billion by selling its own shares in the quarter to 31 August, almost all of the $20 billion at-the-market programme it registered on 23 June, and CoreWeave filed on 17 September for an at-the-market programme of up to 35 million shares. Our reading makes no judgement on the credit of any of these companies.
One direction explains 28% of the joint variance
The rotation ran along a line the structure already held. The strongest direction among the 85 stocks is the sector as a whole: every stock moves with it and the VIX against it, it explains 28% of their joint variance, and the chipmakers follow it most closely. The second direction, with 12%, sets the chip-equipment makers against software and the large US software platforms, and the security companies sit on the software side of it. That is the trade of 14 September.
After those two, the directions fall away quickly. Six explain half the joint variance of the 85 stocks and forty-nine explain 90%, and in the full panel, macro series included, eighteen of ninety-nine can be told apart from statistical noise.
The epicenter moved every day
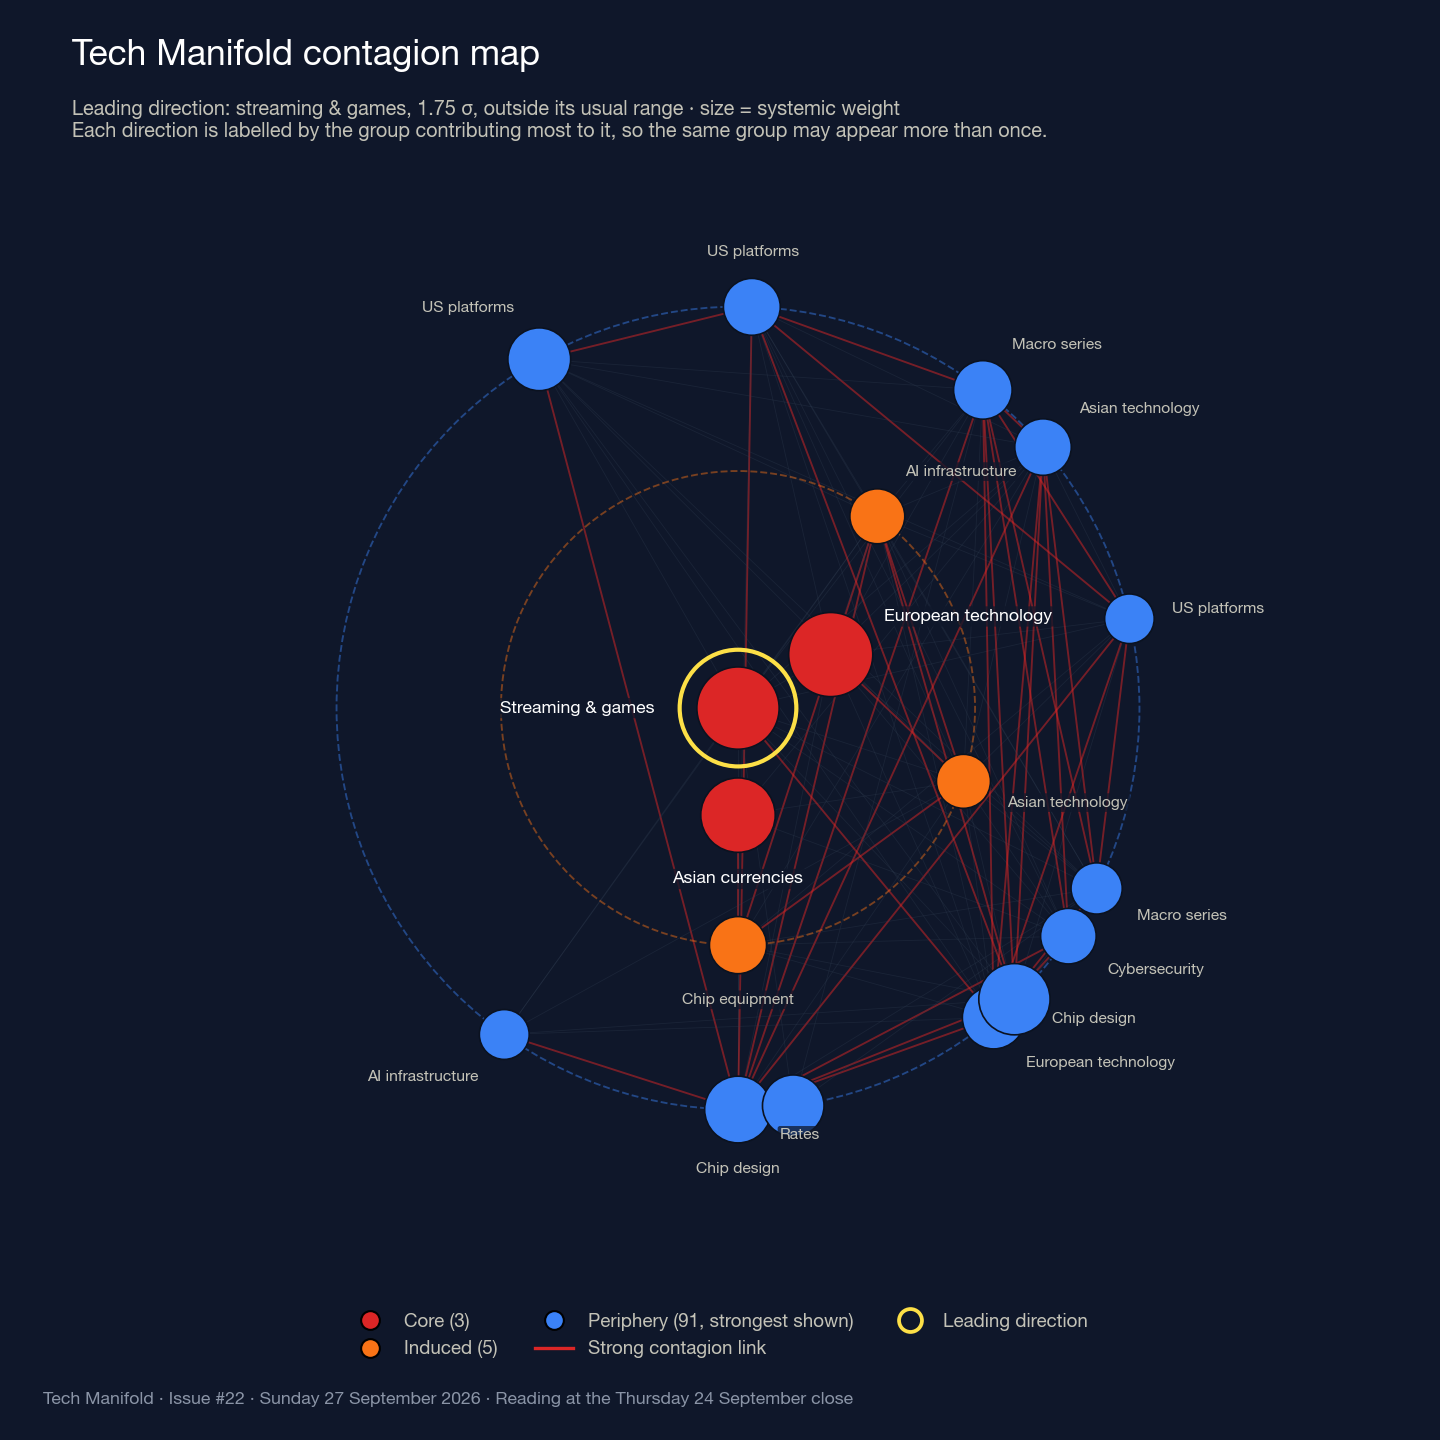
The leading direction of the panel, the one furthest from its own habit, changes quickly and is called an epicenter when it reads 1.64 standard deviations or more. On Wednesday it was the power producers, at 1.93. On Thursday it was a direction tying streaming and games across three continents, at 1.75. Lockstep and epicenter answer different questions: the first shows where diversification has been lost over weeks, the second where the week’s shock is coming from.
For an allocator
What follows is diagnostic and not prescriptive.
Cybersecurity is at once the most tightly bound group of the sector and a diversifier against the chipmakers and AI infrastructure. In a chip-heavy book, cybersecurity currently behaves more like one diversifying exposure than nine independent ones: its members no longer provide the same degree of diversification from one another. The group has also become more volatile, so it diversifies by the direction of its moves rather than by their size.
The rotation of 14 September was not a verdict on AI as a whole. The market bought the chips back within a week while keeping its distance from several balance-sheet-intensive parts of the build-out.
Before Issue #23
Issue #23 reads Thursday 1 October. It will say, whichever way they go:
- whether all nine cybersecurity stocks are still in lockstep on Thursday 1 October.
- whether the two power producers and Oracle remain below their 11 September closes.
- whether the macro state is still Shock and, if it has left, for which state.
- whether cybersecurity still moves against the chip-equipment makers over thirty sessions, its correlation with them below zero.
The largest US memory maker reports its fiscal fourth quarter on Wednesday 30 September.
See which of your own positions move as one →
- The platform → econosysmographe.com/platform · Methodology → econosysmographe.com/methodology · Glossary → econosysmographe.com/glossary · contact@econosysmographe.eu
Notation annex → The measures are experimental research metrics from the Universal Risk Framework (SSRN working papers), not market standards. Lockstep: for each group, the correlation matrix of daily returns over sixty sessions; for each stock, the projected Ricci curvature of that matrix, its absolute value smoothed over twenty sessions; a stock is in lockstep when that value exceeds the 90th percentile of its own past (causal, expanding history). The reading has no sign. On the platform it is the curvature alarm. A direction is an eigenvector of the correlation structure; its share of the joint variance is its eigenvalue over the sum of eigenvalues, computed on the 85 stocks. A direction can be told apart from noise when its eigenvalue lies above the noise edge of a random matrix of the same shape. The leading direction is read in standard deviations from its own history and called an epicenter at 1.64 or more. The macro state has a slow layer (OECD composite leading indicator) and a fast layer that sorts thirteen macro conditions into named regimes; Shock is entered after five consecutive sessions in which their speed exceeds its threshold. Group price changes are equal-weighted averages of closing prices. Full methodology at econosysmographe.com/methodology.
Sources. Dario Amodei, “We Must Pace the Frontier”, darioamodei.com, September 2026. U.S. Treasury, Daily Treasury Par Yield Curve Rates, 17 to 24 September 2026. Cboe: VIX closes and three-month history. ICE BofA MOVE index closes. FRED: SP500, BAMLC0A0CM (ICE BofA US corporate OAS), RIFSPPFAAD90NB (90-day AA financial commercial paper). Exchange closing prices of the 85 stocks (Nasdaq and NYSE), 11 to 25 September 2026. NVIDIA Corporation, CFO Commentary on second-quarter fiscal 2027 results, exhibit to Form 8-K, SEC EDGAR. Oracle Corporation, prospectus supplement dated 23 June 2026 and Form 10-Q for the quarter ended 31 August 2026, SEC EDGAR. CoreWeave, Inc., prospectus supplement dated 17 September 2026, SEC EDGAR. Econosysmographe: Tech Manifold SPD(99) and its group hierarchy, S&P 500 SPD(13), STOXX 600 SPD(20), Base V3. Manifold data as of Thursday 24 September 2026 close. Raw payloads on request.
Disclaimer & Regulatory Status. This document is published for sophisticated, professional, and institutional readers for informational and educational purposes only. It does not constitute investment research within the meaning of regulatory frameworks, nor is it an offer, solicitation, or recommendation to buy or sell any financial instrument. SmartGreenInvest Ltd (Reg. England & Wales No. 14636473) is not an FCA-regulated firm. All analyses are based on public quantitative data and geometric modeling as of the date of publication. Opinions expressed are subject to change without notice. Historical performance and model readings are not indicative of future results. SmartGreenInvest Ltd holds no positions in the issuers named. The author is a self-directed, long-term buy-and-hold investor in US technology equities, at a scale immaterial to the market capitalisations discussed.
By Evangelos Papadopoulos · Independent Researcher · econosysmographe.com