Five Days, One Rotation — How the Hawkish Hold Pivoted the S&P 500 Manifold
From XLI Industrials to XLRE Real Estate in 120 hours. Velocity flipped from slow_reversion to +0.15. FCI rose 9.5%. The hawkish hold is rerouting the asymmetry — and Scenario 3 of Issue #7’s tactical horizon is materialising before our eyes.
Three Manifolds · Special Edition · Wednesday 17 June 2026 close · ~4 min read
What the Fed actually did
Wednesday’s FOMC held the federal funds rate at 3.50–3.75% with a unanimous 12-0 vote. As expected.
The surprise sat elsewhere. The dot plot — the chart of where each committee member projects rates will go — shifted in three months from an average projection of a 25 basis point cut in 2026 (March meeting) to an average projection of a 25 basis point hike (June meeting). A complete reversal of direction.
This is what markets call a hawkish hold: no action today, but a signal the next move is up, not down.
Kevin Warsh’s first FOMC as Chair made the shift visible. The post-meeting statement dropped from over 300 words to around 130. Forward guidance was removed. Warsh announced five task forces to review monetary policy operations, communications, data sources, productivity, and the causes of inflation.
The market read the change immediately. Nasdaq closed −1.34%, S&P 500 −1.21%, Dow −0.98%. The 2-year Treasury yield — the maturity most directly sensitive to Fed policy expectations — repriced higher into the close, reflecting the dot plot adjustment. Mega-cap technology — Microsoft, Meta, Alphabet, Amazon, Nvidia — closed in the red. Semiconductors led the selling.
The reason is not the rate today. It is the discounted cash flow math: when the market expects higher rates ahead, future earnings of long-duration assets (technology) are worth less in present terms. Investors rotated out of high-multiple growth into rate-resilient value and cyclical names.
What the manifold did in five days
Issue #7, published Sunday 14 June and reading the close of Friday 12 June, mapped the S&P 500 contagion network around a specific epicenter:
- PC13 XLI Industrials, induced emission, systemic_norm 0.568, direction SHORT
- XLC Communication Services widest at σ +40.1%
- XLF Financials saturated at periphery absorber (norm 1.0)
- XLK Technology periphery absorber (norm 0.322)
- GLD sub-manifold at +119% above geodesic
The tactical horizon explicitly cadred three scenarios for the FOMC. Scenario 3 was stated as: “Hike — the cluster already in dispersion takes the second hit; pure sectoral procyclicity.”
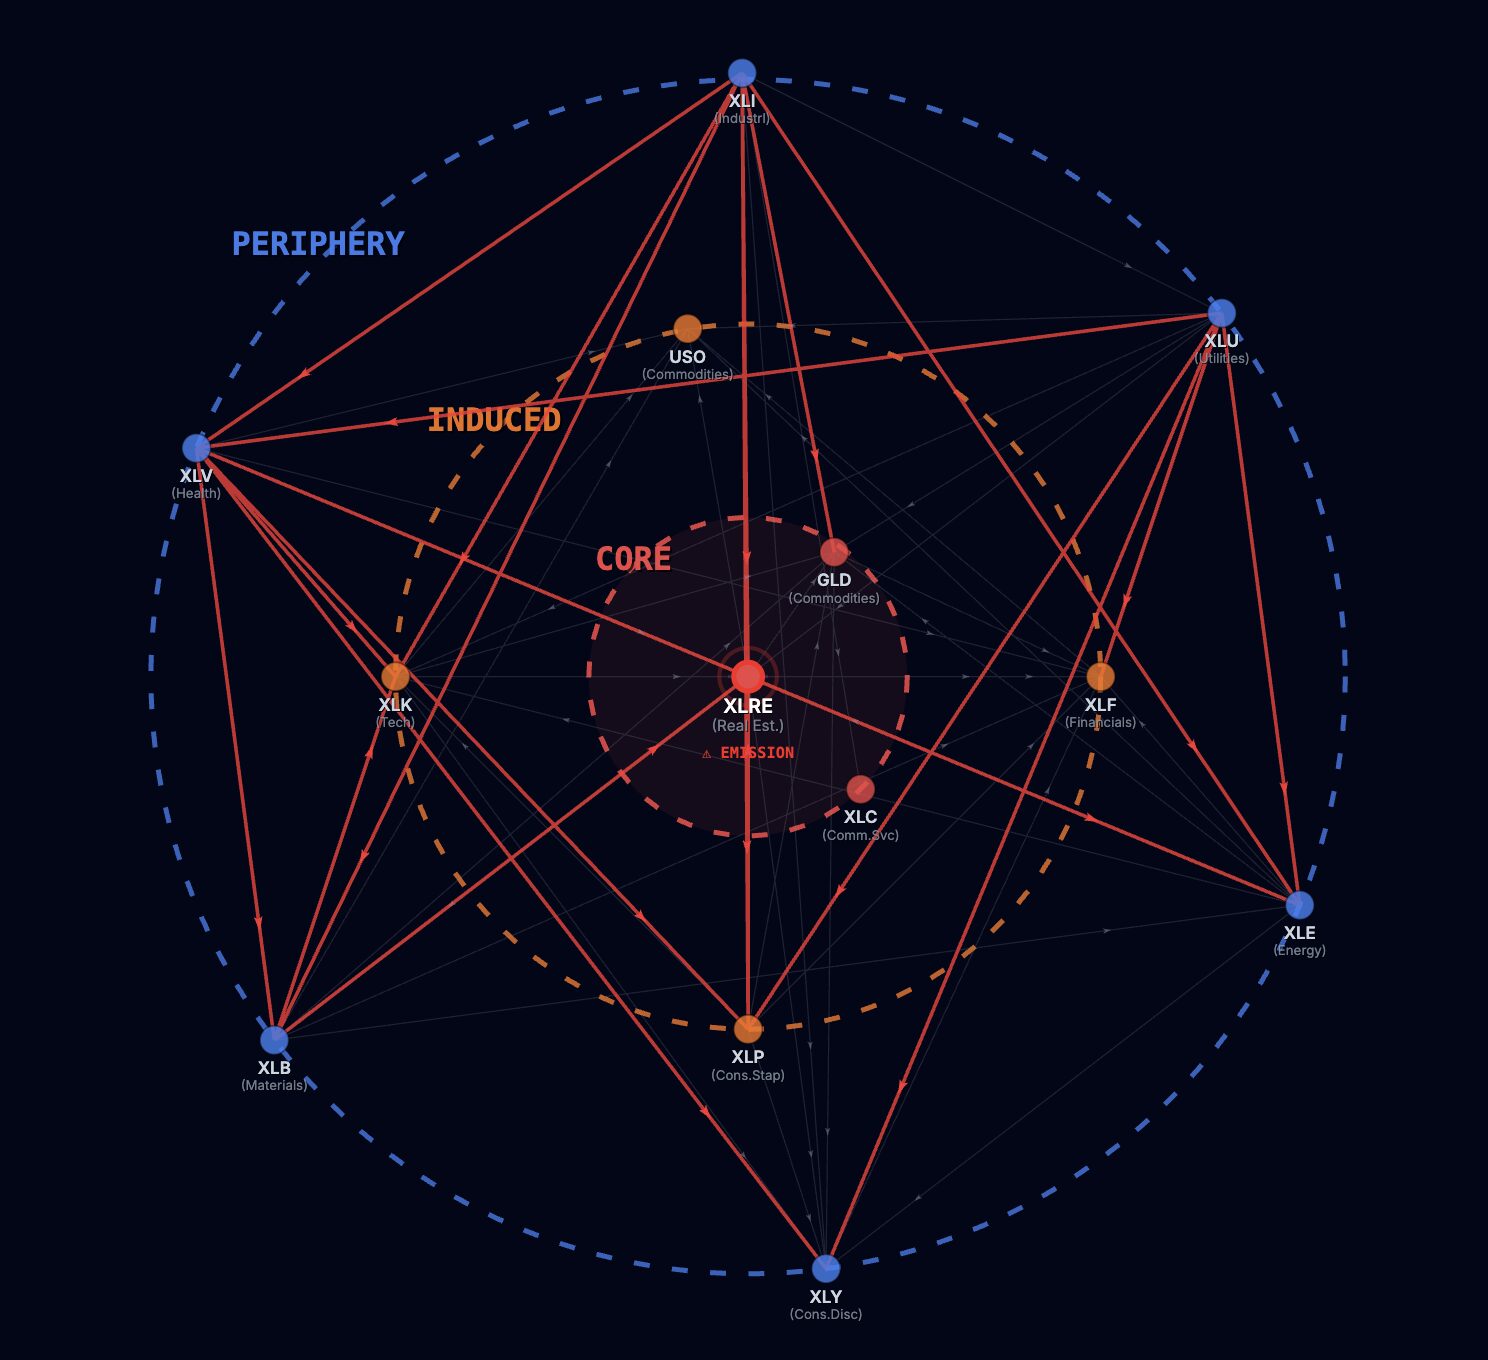
Wednesday’s S&P 500 contagion network, post-FOMC, has rotated:
| Position | Issue #7 — 12 June close | Special Edition — 17 June close |
|---|---|---|
| Epicenter | XLI Industrials (induced emission, SHORT) | XLRE Real Estate (CORE emission) |
| CORE position 2 | — | GLD Commodities (safe-haven flow) |
| CORE position 3 | — | XLC Communication Services (continued) |
| Induced | XLI, XLF, XLB | XLI, XLF, XLK, XLP, USO |
| XLK Technology | Periphery absorber | Induced (Nasdaq −1.34%) |
| Periphery | XLF, XLK, XLE, XLB, etc. | XLV, XLU, XLB, XLE, XLY |
The epicenter rotated from XLI (cyclical, induced layer) to XLRE (rate-sensitive, CORE layer) in five trading days. This is not a daily fluctuation. This is a structural pivot.
Real Estate is the most rate-sensitive sector by construction (long-duration cash flows, leverage, REIT valuation under dividend-discount pressure). The rate-sensitive cluster is absorbing the shock the dot plot has injected into the curve.
The velocity flip — system pivots, no longer stabilises
Beyond the epicenter rotation, three gauge metrics confirm the structural pivot:
| Metric | Issue #7 (12 June) | Special Edition (17 June) | Delta |
|---|---|---|---|
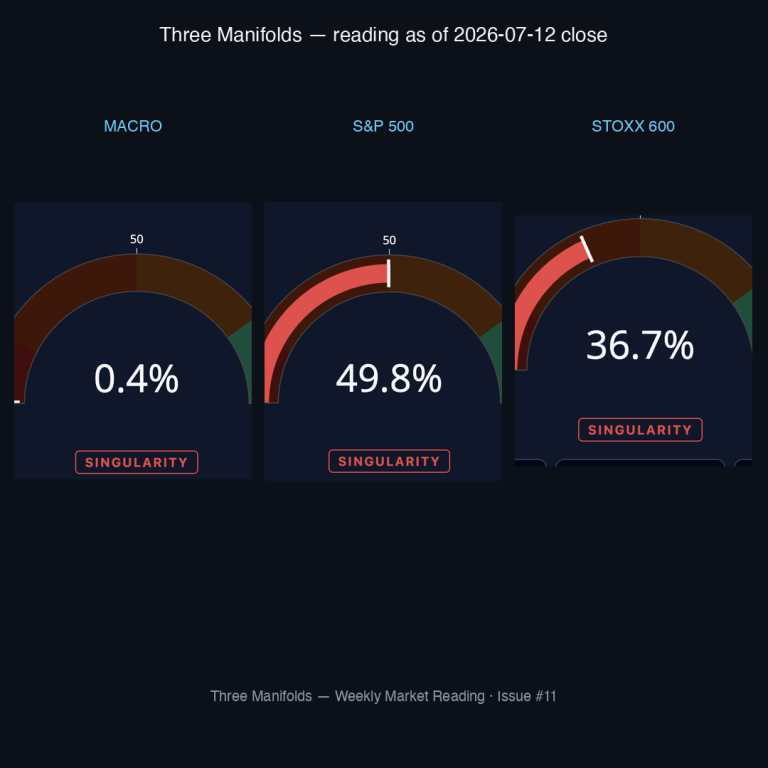
| TSS S&P 500 | 51.10% (Tension) | 50.7% (Tension) | −0.4 |
| DP Velocity | −0.05 (slow_reversion) | +0.15 (positive) | +0.20 FLIP |
| FCI | 0.458 (Calm) | 0.5018 | +9.5% |
| Entropy | 2.70 | 2.6898 | stable |
The TSS staying in Tension territory while velocity flips from negative to positive is the signature of a configuration that no longer stabilises around its previous equilibrium — it pivots toward a new one. FCI rising 9.5% in five sessions confirms financial conditions stress is elevated.
The asymmetry between the FCI move (+9.5%) and the Entropy reading (essentially stable at 2.6898) is also informative: the system is repricing within its current attractor — an equity-volatility shock — without migrating to a structurally different distribution of risk. This is consistent with the cross-asset reading below: an equity DCF reprice on hawkish policy expectations, not a credit-solvency dislocation.
In Issue #7’s language: “the configuration is the configuration; the resolution will be the trajectory.” Today’s reading shows the trajectory has begun.
Cross-asset cross-check — credit did not break
One cross-asset confirmation matters for any reading of the FOMC shock: the equity rate-sensitive reprice of 17 June close was not accompanied by a comparable widening of credit spreads. US investment-grade and high-yield indices (LQD and HYG as observable ETF proxies) repriced moderately but did not break out. The commercial real-estate-backed securities complex (REM as proxy) showed pressure consistent with the XLRE equity move, but without the dislocation typical of a solvency event.
This is what the TSS gauge captures: the system is in Tension territory (50.7%) — not in Stress (>60%) or Crisis (>75%). The manifold reads an equity DCF repricing on hawkish policy expectations, not an immediate banking-stress contagion to credit. The hawkish hold is rerouting the asymmetry — it is not (yet) breaking it.
What this means
Issue #7’s tactical horizon explicitly cadred three scenarios. Scenario 3 was stated as:
“Hike — the cluster already in dispersion takes the second hit; pure sectoral procyclicity. Whatever Wednesday brings, the scalar tool meets a vector dispersion the same way the ECB hike did on European Real Estate.”
We observe; we do not predict. Wednesday’s −1.34% Nasdaq move and the violence of the dot plot reaction make clear the market did not anticipate the full magnitude of Warsh’s hawkish turn. This is not a manifold that “called” the FOMC.
What the manifold did show, in Issue #7, is a structural tension already in place: XLI Industrials in induced emission SHORT, GLD sub-manifold at +119% above geodesic, XLC widest at σ +40.1%. A configuration under stress, with rate-sensitive sectors flagged as the cluster most exposed.
The hawkish hold has been the catalyst that took this latent tension and redirected it: from XLI Industrials (cyclical, induced layer) on 12 June, to XLRE Real Estate (rate-sensitive, CORE epicenter) on 17 June. The same configuration that already mapped Scenario 3 as a path, now traces that path in the network topology.
Real Estate — already flagged in Issue #7 as the STOXX 600 European epicenter — is now also the S&P 500 American epicenter. The configuration is no longer a European rate-sensitive story alone. It is a transatlantic rate-sensitive story, anchored in both manifolds, with the US system actively pivoting.
Observable questions for a risk committee
The reading above is observational; we publish to inform, not to prescribe. For an internal risk committee — the natural reader of a Three Manifolds Special Edition — the configuration raises three observable questions to test against the committee’s own book:
1. Rate-sensitivity concentration. Is the rate sensitivity in your equity book concentrated in the cluster the manifold now flags as the CORE epicenter — Real Estate, REITs, rate-resilient construction-related Industrials? The XLI → XLRE rotation suggests the rate-discount channel has shifted from cyclical exposure (Issue #7) to structurally-sensitive exposure (today). Books calibrated against the 12 June reading deserve a second pass against the 17 June configuration. Caveat the manifold itself raises: this rotation occurred in the immediate aftermath of the FOMC; the committee should validate whether the topological transition is confirmed in Thursday’s and Friday’s block volumes, or whether it reflects a short-term liquidity reprice rather than a structural reallocation.
2. Correlation assumption. Is the assumed correlation between Tech (XLK) and Real Estate (XLRE) — historically modest — still operating as your risk model expects? Both moved into Induced / CORE post-FOMC, suggesting a temporary co-movement that diversification benefits calibrated on 2024-2025 data may underweight.
3. Equity-credit consistency. Does your equity-derived view of the FOMC reaction match the more muted credit-spread reaction described above? If your equity book and your credit book are reading the same shock differently, the manifold reading deserves a triangulation against your internal stress scenarios.
These are observations to be tested against the reader’s own portfolio, methodology, and assumptions. The manifold cadres the questions; the resolution is the reader’s.
Issue #8 — Sunday
Issue #8, published Sunday 21 June, will read the post-Warsh configuration in depth across the three manifolds. The tactical observations for Q3 will be developed there.
Until then: the manifold reading shows where the absorbed shock is now propagating. Whether the Committee actually moves before year-end is the next reading’s question.
Three Manifolds — Weekly Market Reading →
Sources
- NPR — Fed holds interest rates steady and hints at rate hike later this year
- Fox Business — June FOMC: Fed holds interest rates steady as Warsh era begins
- CNBC — Warsh announces task forces to overhaul major Federal Reserve operations
- CNBC — Chairman Warsh drastically alters Fed rate statement
- BBN Times — Nasdaq −1.34% as Fed’s hawkish surprise hits technology stocks
- TheStreet — Stock market today: S&P 500, Nasdaq plummet as Fed points to rate hike
- Federal Reserve Bank of Boston — 2026 Stress Testing Research Conference (5–6 November)
- Three Manifolds — Issue #7: Singularity Asymmetry (14 June 2026)
Educational purpose only. Not financial advice. SmartGreenInvest Ltd (Reg. England & Wales No. 14636473) is not an FCA-authorised firm.
By Evangelos Papadopoulos · Independent Researcher · econosysmographe.com