The Sell-Off Hit Cyclicals, Not Technology. Market Structure Did Not Move.
If this week’s drawdown was booked as a technology event, the correlation geometry disagrees. On three panels the stress entered through energy and utilities, moved the transmission roots onto Industrials in New York and Construction in Europe, and did not tighten the structure of either market.
Data as of Thursday 3 September 2026 close · 6 min read
The reading in 30 seconds
- Global composite: TSS 23.4%, Singularity. The emission root is global utilities, in the core. Recomposed to 89 nodes on 2 September: no comparison yet.
- S&P 500: TSS 55.4%, Tension, up 0.8. The root rotated from Staples to Industrials, in the core, with Financials and Materials.
- STOXX 600: TSS 49.6%, Tension, up 0.6. Construction keeps the root at the top of the engine’s scale; displacement turned from reversion to escape.
- The base: Expansion since 12 June, 59 sessions. The sell-off raised a shock candidate for two sessions; five are needed for a state change.
- The audit: of Wednesday’s four markers, one present, one flat, two absent. Last week’s Observation 3 triggered at the margin; Observation 4 holds.
In one line: TSS scores how evenly risk is spread across a panel (low = concentrated); Singularity, Tension and Isotropic are its zones; the emission root is the node transmitting the most stress; core, induced and periphery are network positions. Full definitions in the notation annex and the glossary.
The week
Monday. The first session after Sunday’s US strike on Iranian rocket launchers on Larak Island and Iran’s missile reply overnight; two tankers laden with Saudi crude hit east of Khasab; Brent up 3%; month-end flows; the tape red across assets. Tuesday. A wider wave of US strikes on Iranian targets around the Strait of Hormuz; Brent extends the move by nearly 5%, to $96 at the settle; the worst technology session since mid-August; sovereign bonds selling off from Frankfurt to New York.
Wednesday. Microsoft opens the Azure counter for the first time: $101.9 billion in the fiscal year.
Thursday. Our reading: the Bund at 3.42%, up 18 basis points on the week; the US 10-year at 4.77%. Friday, after our reading. Payrolls up 162,000 against a 53,000 consensus, the strongest month since March after a year averaging 31,000; unemployment 4.1%.
Behind the week: second-quarter growth of 1.5%, led by consumers; federal debt above $40 trillion since 18 August; euro-area retail sales down 0.6% in July, Germany’s down 3.4%.
The consensus read the week as the AI trade meeting monetary gravity. The manifolds read where the gravity landed: on utilities, industrials and construction, the sectors that price energy and rates. Neither equity panel’s structure tightened. The shock was real. It was not structural.
Global composite — 89 nodes
At Thursday’s close the composite reads TSS 23.4%, Singularity, FCI 0.29; 54 of 89 nodes in rupture. The widest gaps: MSCI China +73%, short-dated US Treasuries +52%, MSCI Korea +43%. The emission root sits on global utilities, in the core, with US utilities and global industrials alongside it in the cluster — the energy-and-infrastructure address of the Hormuz week.
S&P 500 — eleven sectors, gold and oil
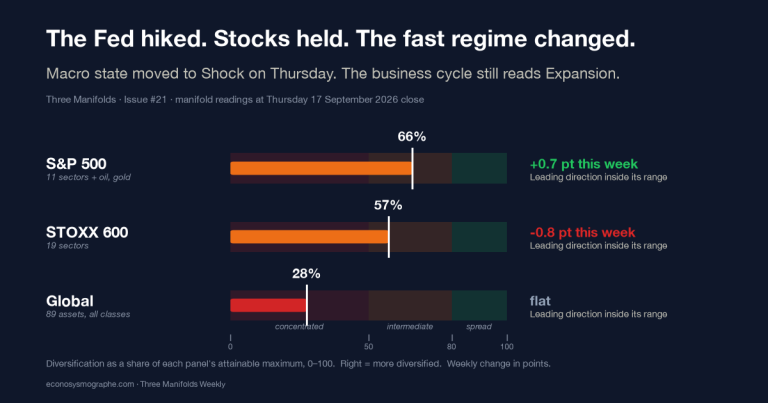
TSS 55.4% Tension (▲ +0.8), FCI 0.36; velocity (how fast the structure is moving, see annex) in slow reversion. All thirteen nodes in rupture, mean absolute dispersion 28.4%; zones 2 core / 5 induced / 6 periphery, unchanged.
The root rotated from Consumer Staples, on the induced ring, to Industrials, in the core, with Financials and Materials alongside it — the cyclical, rate-sensitive trio, where a week earlier the cluster read Health, Staples, Technology. A different node, a different zone, a different cluster. The widest gaps are gold at +52%, oil at +37%, Communication Services at +36%; the technology sector sits at +19%.
STOXX 600 — nineteen sectors and the broad index
TSS 49.6% Tension (▲ +0.6; zones are set on TSS*, see annex), FCI 0.41; velocity turned from slow reversion to slow escape, the only one of the two sector panels whose displacement changed direction. All nineteen sectors in rupture, mean absolute dispersion 26.7%; zones 3 / 7 / 9, unchanged.
Construction held the root, its systemic norm rising from 0.86 to 1.00, the top of the engine’s scale, and moved from the core to the induced ring. Its cluster of Autos and Chemicals is unchanged; its own dispersion moved less than a point. The stress sits in the sector’s position in the network, not in its price: it was the panel’s dominant transmitter on the week the Bund repriced and the retail-sales miss printed.
The widest gaps: Telecom at +37%, Media and Basic Resources at +33%.

The base
Thirteen coordinates of rates, liquidity, currencies and credit, read as a state machine under the panels: a slow layer that names the regime and a fast layer that flags shocks. At Thursday’s close the slow layer read Expansion, since 12 June — 59 sessions in the state, against a historical mean of 26 and a maximum of 68 — on the business-cycle phase published by the OECD, with no exception state active.
The fast layer raised a shock candidate on Wednesday and Thursday; a candidate must hold five sessions to become the state, and it had held two.
Levels on the week: MOVE 71.0 → 74.7 (peak 79.7 on Wednesday) · 10-year breakeven 2.31% → 2.35% · Bund 3.24% → 3.42% · dollar index 99.7 → 98.9.
A shock registered by the fast layer, on a slow layer that did not move.
Book a discovery session on your own exposure →
The audit
Pre-registered at Issue #18. Observation 1 (Nvidia 10-Q customer concentration): carried, reported as filed in Tuesday’s brief. Observation 2 (Meta capex): not observable before late October. Observation 3 (semiconductor-equipment block above TSS* 28, the stabilised score used for the Tech panel): triggered at the margin, 28.2 from 26.2. Observation 4 (macro-context alarm attribution below 10% through the FOMC week): holding, 2.1%.
Markers posted Wednesday.
| Marker | Wednesday | Thursday | Verdict |
|---|---|---|---|
| Brent above ~$95 | $96.02 (Tuesday settle) | above $96 (public quotes) | present |
| 10-year breakeven climbing | 2.35% | 2.35% | flat |
| Rates volatility elevated past month-end | MOVE 79.7 (peak) | 74.7 | absent — eased |
| Tech core zone expanding | 13 nodes | 14 nodes | absent — 14, as on 28 August |
For an allocator
Diagnostic, not prescriptive: configurations to re-cost, not positions to take.
- A hedge sized on this week’s drawdown is sized on a macro shock. The loss came through energy and rates; neither sector structure tightened.
- The S&P’s transmission now runs through its cyclicals. Industrials, Financials and Materials form the root’s cluster: three sector bets, one channel, and it is the channel most exposed to the rates layer on this reading.
- The European cyclical complex transmits more than it prices. Construction at the top of the engine’s scale, Autos and Chemicals in its cluster, dispersion unchanged: the exposure is not in the sector’s own volatility but in what its shock would do to the rest of the panel.
What we pre-register for Issue #20
Each test is read on the platform’s 16 September computation (17 September for the base) and reported in Issue #20 whichever way it goes.
- Macro-context alarm attribution stays below 10% through the FOMC week (decision 16 September).
- STOXX 600 Construction keeps the root with a norm above 0.8 at the 16 September close. Falsified if it rotates or falls below 0.8.
- The S&P root stays on the cyclical cluster (Industrials, Financials, Materials) at the 16 September close. Falsified if it rotates to a defensive sector.
- The base’s shock candidate has become the state by 17 September. Falsified if it lapses.
Tuesday: the Tech brief on Friday’s data, Nvidia included.
- The platform → econosysmographe.com/platform · Methodology → econosysmographe.com/methodology · Glossary → econosysmographe.com/glossary · ops@econosysmographe.eu
Notation annex → The measures are experimental research metrics from the Universal Risk Framework (SSRN working papers), not market standards. TSS scores how evenly risk is spread across the directions of a panel’s correlation structure (100% = evenly spread; low = concentrated); zones are Singularity, Tension and Isotropic, on the dimension-normalised TSS\* with thresholds at 50 and 80. FCI (0–1) captures how tightly the panel co-moves as one stress cluster. σ is the gap between an asset’s spot and its geometric-equilibrium price on the panel — a structural reference, not a target; rupture = stretched beyond the band, suture = inside it. The emission root (epicenter) is the node emitting the most stress into the rest of the structure; core / induced / periphery are topological positions. Systemic norm is a node’s weight in the contagion network on a 0–1 scale; velocity is the pace of the panel’s geodesic displacement — the distance the correlation structure has travelled from its reference — labelled reversion (moving back toward it) or escape (moving away); it is independent of the TSS level. Full methodology, including the reading-date rule, at econosysmographe.com/methodology.
Sources. BLS, The Employment Situation — August 2026 (4 Sept). BEA, GDP (Second Estimate), Second Quarter 2026 (26 Aug). US Treasury, Fiscal Data, Debt to the Penny. Microsoft, Form 8-K and investor materials, Azure disclosure (2 Sept). Eurostat, Euro indicators — Volume of retail trade, July 2026 (4 Sept); Destatis for Germany. FRED: DCOILBRENTEU, DGS10, T10YIE; Brent Thursday level from public quotes (CNBC, 3 Sept). Larak Island strike and Iran’s reply: Washington Post, CNN, Al Jazeera (30 Aug); tanker hits and the Monday session: AP (31 Aug); the Tuesday wave and session: Axios, CNN, Yahoo Finance (1–2 Sept). Econosysmographe: Global Systemic Composite SPD(89), S&P 500 SPD(13), STOXX 600 SPD(20), Base V3; Tech Manifold Live SPD(99) for the two audited observations. Manifold data as of Thursday 3 September 2026 close (reading-date rule on the methodology page). Raw payloads on request.
Disclaimer & Regulatory Status. This document is published for sophisticated, professional, and institutional readers for informational and educational purposes only. It does not constitute investment research within the meaning of regulatory frameworks, nor is it an offer, solicitation, or recommendation to buy or sell any financial instrument. SmartGreenInvest Ltd (Reg. England & Wales No. 14636473) is not an FCA-regulated firm. All analyses are based on public quantitative data and geometric modeling as of the date of publication. Opinions expressed are subject to change without notice. Historical performance and model readings are not indicative of future results. SmartGreenInvest Ltd holds no positions in the issuers named. The author is a self-directed, long-term buy-and-hold investor in US technology equities, at a scale immaterial to the market capitalisations discussed.
By Evangelos Papadopoulos · Independent Researcher · econosysmographe.com