
Issue #3 — Three Manifolds · Weekly Market Reading. The macro manifold’s distance from baseline rose +31% in seven days — its largest single-week move on record — while its trajectory flipped from reversion to escape.
Sunday 17 May 2026 · Reading as of Friday 15 May 2026 close · 6 min read
Key takeaways
- Macro FCI jumped +31% in one week (0.5739 → 0.7542) — largest single-week move we have recorded.
- Velocity flipped positive on Macro and S&P simultaneously — trajectory now escaping baseline, not reverting.
- All three manifolds emit contagion from the same commodity/materials family.
- S&P 91% in Rupture, STOXX 90% — twin overextension, near-identical extreme gaps (+39%).
Institutional readers — see how the manifold reads your portfolio.
The 31% FCI shock
On Friday 15 May, the macro manifold’s Financial Connectedness Index rose from 0.5739 to 0.7542 — a +31% single-week jump, the largest we have recorded in this series, and now roughly 80% of the post-COVID calibration peak of 0.9449. The geometric distance from baseline did not drift; it accelerated. And it did so while TSS stayed flat in deep Singularity (1.9%) — distance widening without dispersion widening. In plain terms: the system is moving away from equilibrium fast, and the move is concentrating rather than spreading out. For an institutional allocator, the relevant question this week is not which asset moved — it is that the geometry of the whole macro layer repriced its distance from normal in a single week, against a calm news tape that does not yet reflect it. One caveat we state upfront: 15 May was the third Friday of the month — monthly equity-options expiration — so part of a single-week jump can be expiry-related dealer-hedging flow rather than a persistent regime shift. We cannot rule that out from one reading. The post-expiry reading is what discriminates a true escape from an expiry artefact.
Macro · 77 nodes
- TSS 1.9% — Singularity zone (flat vs 2.1%)
- FCI 0.7542 (+31% vs 0.5739 — record single-week move)
- Velocity +0.12 (slow escape — flipped from −0.03 reversion)
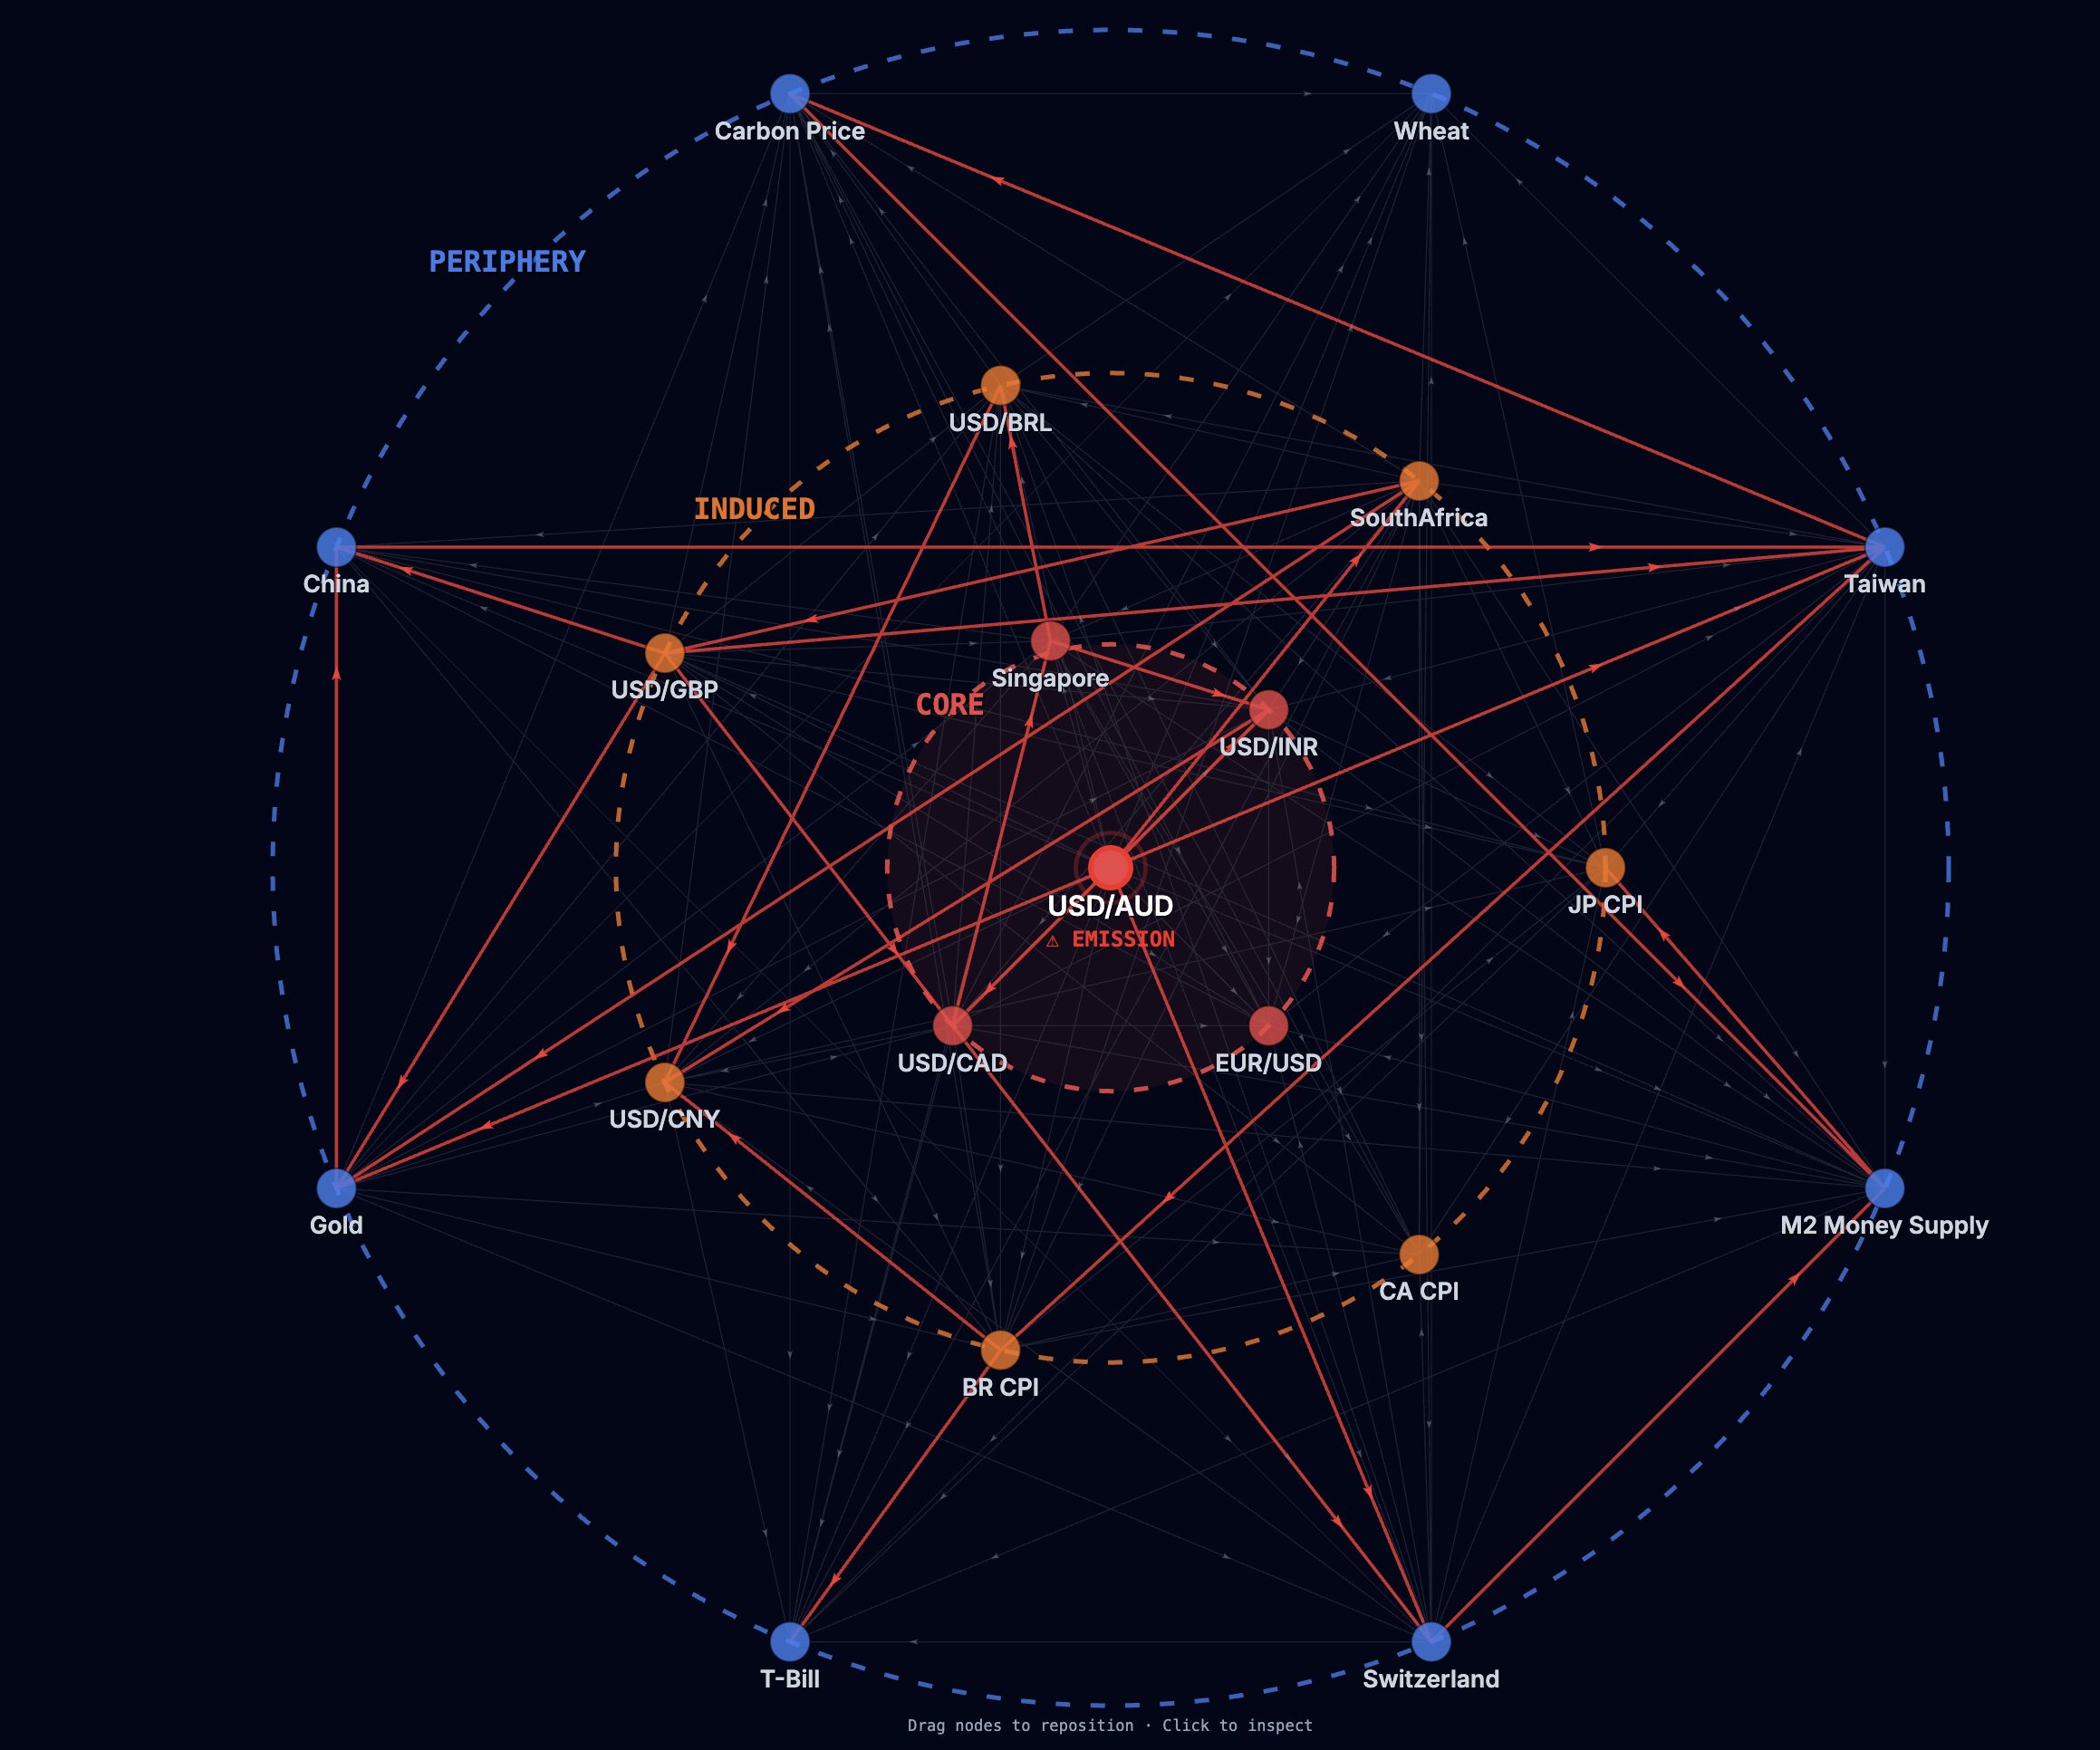
- Epicenter (CORE, EMISSION) : USD/AUD
The velocity sign matters here, so we state the convention explicitly: velocity is the time-derivative of the geometric distance. Positive means the manifold is moving away from baseline (escape); negative means it is returning (reversion). Macro flipped from −0.03 to +0.12 — from reverting to escaping. The CORE ring is entirely FX — USD/AUD (emission), USD/CAD, EUR/USD, USD/INR, Singapore — while safe havens (Gold, T-Bill, Swiss franc) remain in the periphery. Entropy at 3.8210 sits below its 4.2005 long-run mean: stress concentrating, not dispersing. The emission node, USD/AUD, is a commodity-currency risk proxy — the first of three commodity-family signatures this week. For an allocator: a +31% distance move with flat dispersion means the diversification embedded in a multi-asset book is degrading faster than realised vol or the news tape currently shows — cross-asset correlation assumptions are the first thing to re-examine, not the equity sleeve.
United States · S&P 500
- TSS 50.6% — Tension zone (+0.3pp vs 50.3%)
- 10 of 11 sectors in Rupture (unchanged, panel-wide)
- Mean residual σ̄ = +24.9% above the geodesic
- Widest gap : Communication Services (XLC) at +39.5%
- Epicenter : XLB (Materials)
| Sector | ETF | Deviation σ above geodesic |
|---|---|---|
| Communication Services | XLC | +39.5% |
| Energy | XLE | +29.4% |
| Real Estate | XLRE | +28.7% |
| Consumer Discretionary | XLY | +28.3% |
| Utilities | XLU | +23.2% |
| Materials | XLB | +23.0% |
| Industrials | XLI | +21.9% |
| Financials | XLF | +20.9% |
| Health Care | XLV | +17.9% |
| Consumer Staples | XLP | +15.9% |
| Technology | XLK | +14.8% |
The S&P panel is 91% Rupture with zero Compression — every sector except one trades above its geodesic. Two dissociations are worth noting. First, the epicenter and the widest gap are different sectors: contagion is emitted by Materials (XLB, dynamic coupling) while the largest static divergence is Communication Services (XLC, +39.5%, spot ~48% above geodesic). These are different axes — do not conflate them. Second, Technology is the only sector at geometric equilibrium (Suture, +14.8%) — the least overextended sector, not the most. The Cone Matrix confirms the texture: top distance loadings sit on GLD, USO and XLB (commodities/materials), while the dominant market mode PC1 carries a low loading (3.62). The stress is not broad-market beta — it is concentrated in commodity sub-modes. For an allocator: a book hedged for a growth/tech drawdown may be mishedged here — geometrically Tech is the least stretched sector, and the fragility sits in the commodity/inflation channel and in the sectors a value or defensive tilt typically overweights (Comm Services, Energy, Real Estate).
DACH · STOXX 600
- TSS 25.1% — Singularity zone (−0.7pp deeper vs 25.8%)
- 18 of 20 sectors in Rupture (panel-wide)
- Mean residual ≈ +27% across the 18 Rupture sectors
- Widest gap : Insurance at +39.9%
- Epicenter : Chemicals
| Sector | Deviation σ | Regime |
|---|---|---|
| Insurance | +39.9% | Rupture |
| Personal & Household Goods | +36.3% | Rupture |
| Construction | +32.0% | Rupture |
| Automobiles | +29.5% | Rupture |
| Real Estate | +29.4% | Rupture |
| Food & Beverage | +29.2% | Rupture |
| Media | +28.4% | Rupture |
| Oil & Gas | +27.2% | Rupture |
| Financial Services | +26.3% | Rupture |
| Basic Resources | +25.1% | Rupture |
| Banks | +24.3% | Rupture |
| Retail | +24.2% | Rupture |
| Industrials | +23.6% | Rupture |
| Telecom | +23.5% | Rupture |
| Chemicals | +22.5% | Rupture |
| Health Care | +22.4% | Rupture |
| Broad Market | +21.7% | Rupture |
| Technology | +19.9% | Rupture |
| Utilities | +14.0% | Suture |
| Travel & Leisure | +12.0% | Suture |
STOXX deepened for a third consecutive week in TSS (−0.7pp) but its velocity remains negative (−0.06, slow reversion) — it has not flipped to escape. So it reads as structural confirmation, not a dynamic signal: 90% Rupture, the same panel-wide overextension as the S&P, with only Utilities and Travel & Leisure at equilibrium. The DACH-specific note: the widest European gap is Insurance (+39.9%, spot ~49% above geodesic), almost numerically identical to the S&P’s widest gap. Two independent equity universes, the same extreme signature. For an allocator: a European book is not yet on the dynamic signal the US/Macro layers are flashing — but its static overextension is already as stretched, and concentrated in Insurance and Personal & Household Goods rather than where a DACH mandate usually carries beta.
Cross-layer takeaway
Three independent geometric instruments and the news tape converge on one reading this week. First, all three contagion epicenters belong to the same family: USD/AUD (macro, commodity-currency FX), XLB Materials (S&P), Chemicals (STOXX). Second, the S&P Cone Matrix puts its largest distance loadings on commodities (GLD, USO) and Materials, with the broad-market mode carrying a low loading — the stress is in commodity sub-modes, not in market beta. Third, the news tape: an explicit divergence flag (geometry calm, news bearish), reporting on US-Iran tensions keeping rate cuts unlikely amid sticky inflation, higher fuel prices, and rotation out of hyperscalers into energy. The geometry and the narrative point the same way — a commodity/real-asset stress origin — even though the news sentiment screen still reads neutral-to-bearish rather than alarmed. Velocity adds the trajectory: Macro and S&P have inflected to escape; STOXX still reverts. Two of three manifolds have changed direction. Note the magnitudes: +0.12 and +0.07 are slow-escape, not violent — an early inflection, observed over six weeks of this series, not a universal law. The S&P and STOXX panels both satisfy panel-wide Rupture, but only at ~2–3 weeks sustained; the historical ≥1-calendar-month trigger is not yet met, so we attach no drawdown analog this week.
What this means for an asset manager
Strip the geometry away and the reading translates into four concrete questions for a book this week. One — correlation risk. The +31% macro distance jump with flat dispersion says the diversification you are paying for is thinning before realised vol prints it; risk-parity and vol-target sleeves are the exposures whose assumptions age fastest in this configuration. Two — the hedge vector. The stress origin is commodity/real-asset and inflation, not growth/tech — a portfolio insured against an equity-growth selloff is hedging the wrong axis. Three — where the stretch actually is. The most overextended sectors are the ones a value or defensive tilt tends to be long (Communication Services, Energy, Real Estate, European Insurance); Technology is the single sector at equilibrium. Four — the watch item. The pattern that historically matters is panel-wide Rupture sustained one calendar month plus a STOXX velocity flip; neither is met yet, so this is a monitoring trigger for the next two to three weeks, not a reallocation trigger today.
Tactical horizon
We observe a configuration, not a forecast. The σ values measure log-space divergence from the geodesic — not price targets, and “closing the gap” figures are conditional arithmetic, not predictions. What changed this week is the rate and direction of the macro layer’s distance from baseline, corroborated by a coherent commodity-origin signature across three layers and the news tape. What has not yet changed: aggregate dispersion (still compressed), the STOXX trajectory (still reverting), and the ≥1-month historical trigger (not met). And one confound is open: the reading lands on monthly options expiration, so the single decisive test is whether the macro distance holds above ~0.75 once expiry flows clear — that is the one observation worth watching into next week. This is a horizon signal, not a timing signal.
See the reading on your own portfolio
This is Issue #3 of Three Manifolds — Weekly Market Reading. New reading every Sunday until early November 2026.
- Institutional POC — see how the manifold reads your portfolio → econosysmographe.com/institutional-access
- Methodology + 4 SSRN papers → econosysmographe.com/methodology
- Direct contact → contact@econosysmographe.eu
Educational purpose only. Not financial advice. SmartGreenInvest Ltd (Reg. England & Wales No. 14636473) is not an FCA-authorised firm.
By Evangelos Papadopoulos · Independent Researcher · econosysmographe.com