The Ten-Year Hit 5.29% and Credit Spreads a Six-Month High. Our S&P 500 Sector Panel Is the Most Diversified Since Marc
The ten-year Treasury yield closed at 5.29% on Wednesday 30 September, its highest daily close of 2026, and by Thursday’s close diversification in our US sector panel had risen to its highest level since March. The panel covers eleven S&P 500 sectors, oil and gold. The fast layer of our macro state remained in Shock for an eleventh session. Friday’s employment report, 29,000 jobs added, came after our reading.
Manifold data as of Thursday 1 October 2026 close · Market data through Friday 2 October · 8 min read
The reading in 30 seconds
The stress of the week sits in rates and credit. The S&P sector panel showed no added concentration: it was more diversified on Thursday than at any time since March, its fifth week without a decline, and no direction of co-movement reached the 1.64 threshold that names an epicenter.
In the composite of 89 assets we read across all asset classes, the direction that groups Treasuries had left its range on 23 September, at 1.75 standard deviations relative to its own history. In the runs available to us, which receive the Treasury closes a day late, it has been inside its range on every session since 24 September. The macro state is still Shock, in its fast layer only, since 17 September.
See this reading on your own book →
The week
Rates carried the week again. On the Treasury’s daily par curve the ten-year yield rose from 5.18% on Thursday 24 September to 5.29% on Wednesday 30 September, its highest close of 2026, before easing to 5.24% on Thursday. The thirty-year closed at 5.64% on Wednesday, also a high for the year, and the two-year fell from 4.87% to 4.78% over the week, so the gap between the two rose from 31 to 46 basis points. The ICE BofA MOVE index of Treasury volatility closed at 110.45 on Wednesday, a three-month high, and the Cboe VIX rose from 15.67 to 16.39.
The option-adjusted spread of the ICE BofA US corporate index, on the Federal Reserve Bank of St. Louis’s FRED series, widened from 79 basis points on 24 September to 86 on Thursday, its widest since 7 April and below the 94 of 16 March. The S&P 500 lost 0.5% over the five sessions to Thursday, closing at 7,666.45.
On Friday, after our reading, the Labor Department reported that employers added 29,000 jobs in September, against an average of 45,000 a month over the prior twelve months, and revised July to a loss of 10,000. The S&P 500 rose 0.7% to 7,722.72 and the ten-year yield closed at 5.28%.
New York: the most diversified since March, and no direction outside its range
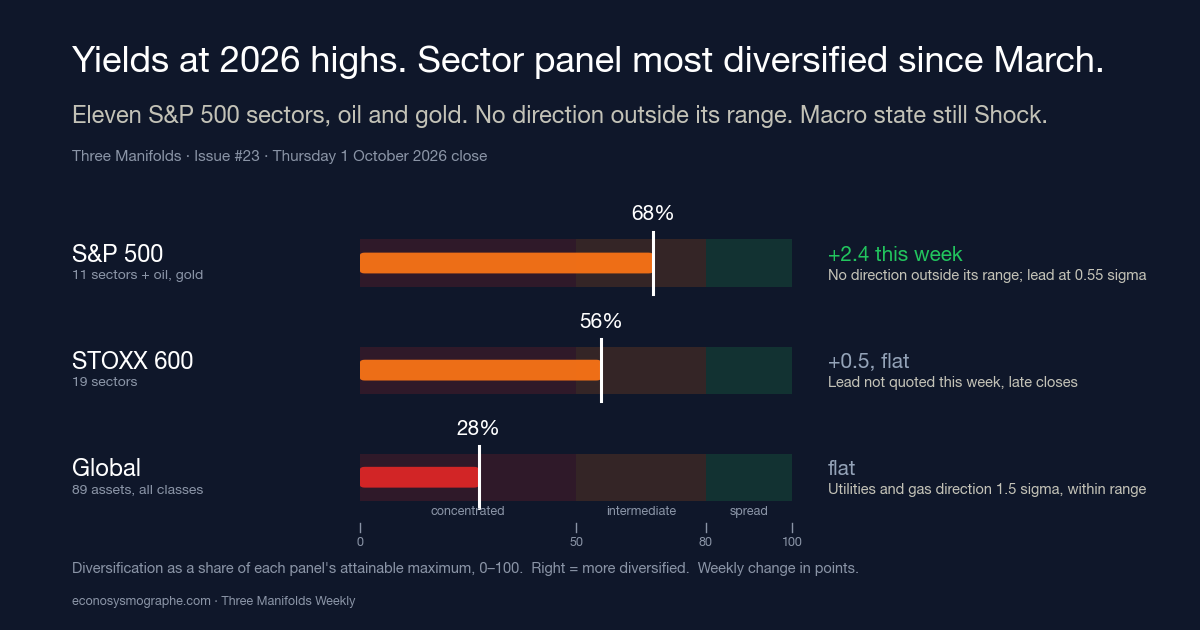
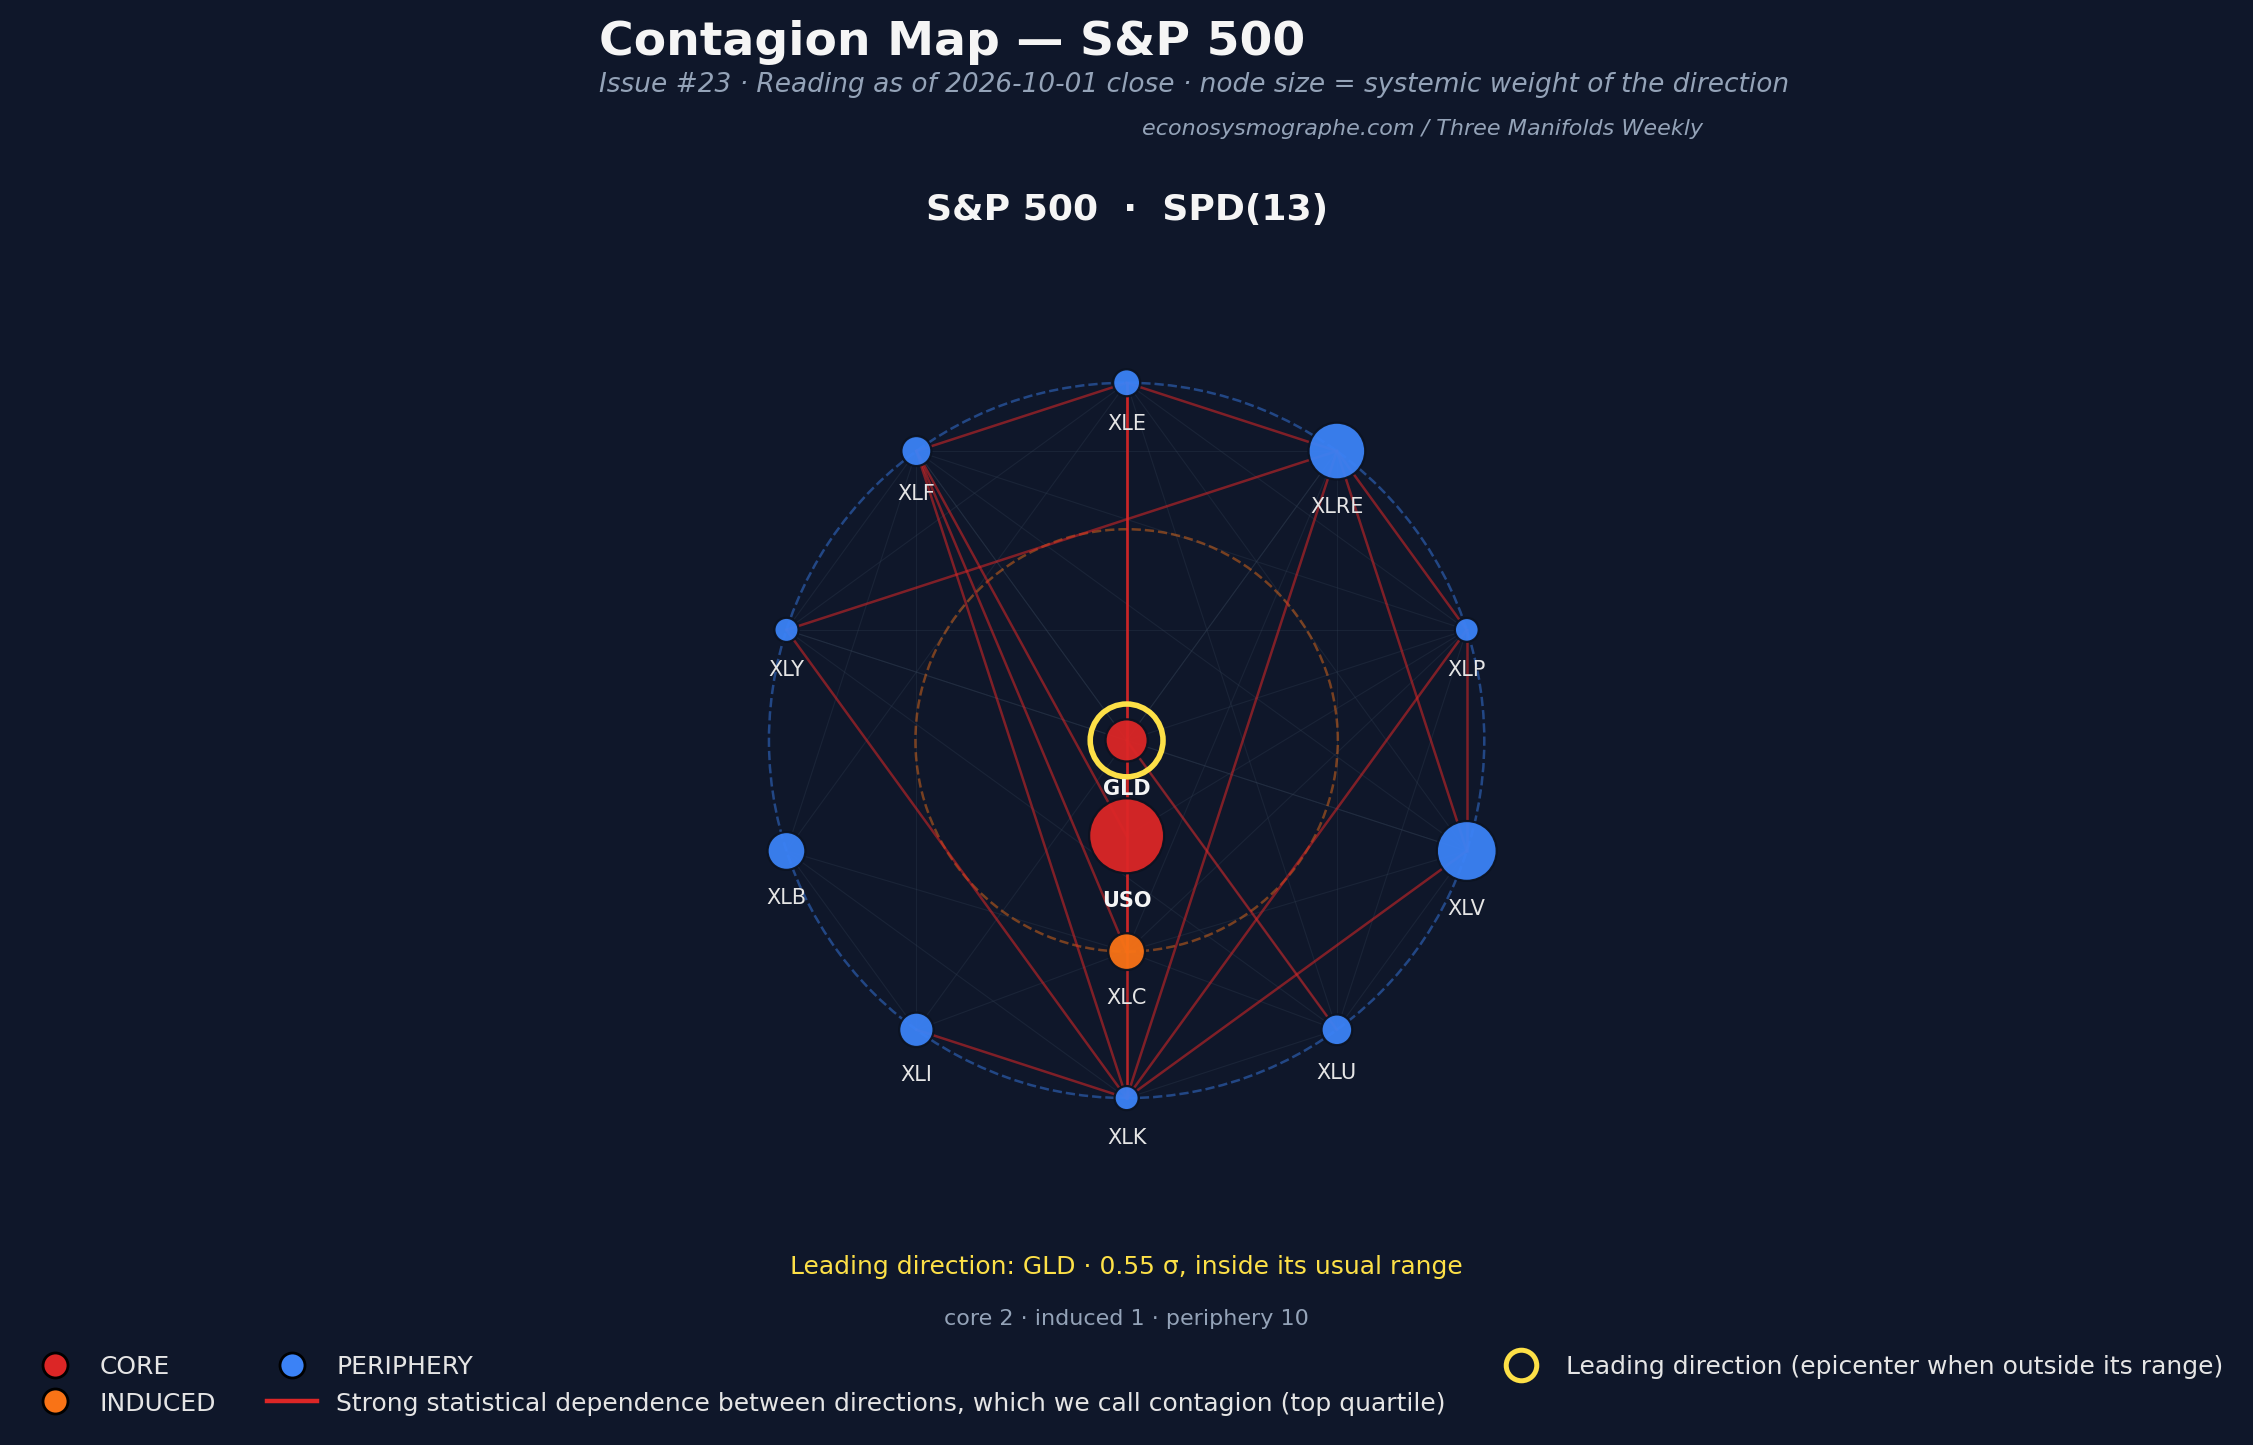
On Thursday the lead of the thirteen-asset panel was a direction tying gold to Technology and Consumer Staples, at 0.55 standard deviations relative to its own history, inside its range. A different direction, one that groups the oil fund, Energy and Staples, was the most unusual of all at 1.32, but the model classifies it as absorbing stress rather than transmitting it, so it is not the lead, and it too sat inside its range. How the lead is selected, and when it is called an epicenter, is set out in the notation annex.
The panel’s diversification score, which counts how evenly risk is spread across the panel’s directions, stood at 67.9% of the ceiling a thirteen-asset panel can attain, against 65.5% a week earlier and 61.5% on 27 August, and has not been higher since 19 March.
The two measures answer different questions: the diversification score says how evenly risk is spread across the panel, and the reading of a direction in standard deviations says how unusual its behaviour is against its own history. Of the thirteen assets, the two core directions are led by gold and by oil, with Consumer Staples present in both, Communication carries the one induced direction, and Financials, the epicenter of 10 and 14 September, sits in the periphery for a third week.
Europe: flat, and the lead not quoted this week
The European panel’s diversification stood at 55.8% of its ceiling on Thursday, against 55.3% a week earlier, a change we call flat. Thursday’s closes of twelve of the nineteen sectors reached our Thursday run late, so the level is taken from Friday’s run, which holds those Thursday closes, and the lead is not quoted.
On the last reading we can quote, Thursday 24 September, the lead of the European panel was a direction tying Media, Basic Resources and Health Care, at 0.81, inside its range, after two weeks on Health Care and property. European Utilities sit this week in the global composite’s leading direction, with natural gas and the carbon price.
Under the panels: Shock for an eleventh session, and the Treasury direction back in its range
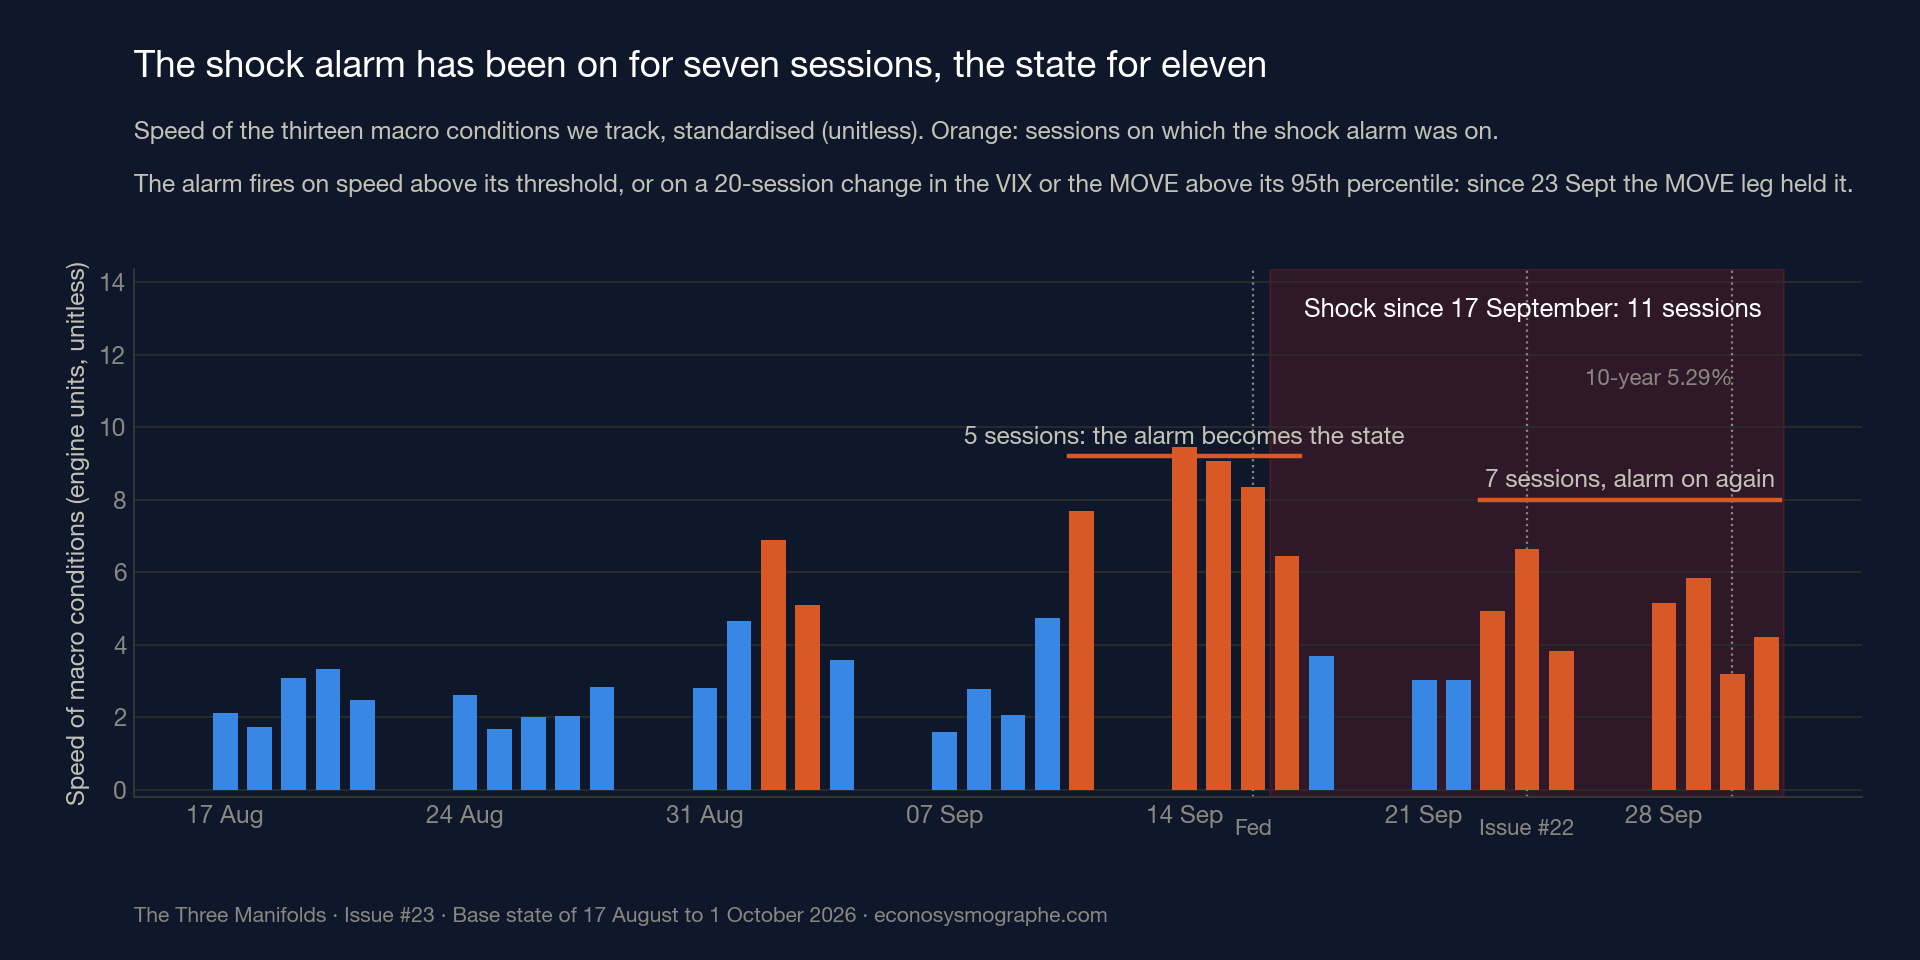
The fast layer of our macro state, which sorts thirteen conditions such as real yields, the two yield curves, volatility and the dollar into named regimes, has read Shock since Thursday 17 September, eleven sessions through Thursday, and the alarm that moves it has been on for seven sessions in a row since Wednesday 23 September. The alarm fires on any of three conditions: the speed of the thirteen conditions above its threshold, fixed at calibration, or the twenty-session change in the VIX or in the MOVE index above its own 95th percentile. Over these seven sessions the leg that held was the MOVE index, whose twenty-session change stayed above its 95th percentile from 23 September to Thursday, while the speed itself read below its threshold on Wednesday 30 September and Thursday 1 October. The business cycle, on the OECD’s leading indicator, has read Expansion since February.
The composite of 89 assets, which reads the two sector panels together with rates, currencies, commodities and the other regions, reads the same week through co-movement rather than levels. On 23 September, the day of the largest one-day rise in the ten-year yield this year, the direction that groups Treasuries read 1.75 standard deviations relative to its own history, outside its range. In the runs available to us, which receive the Treasury closes a day late, it has stayed inside its range on every session from 24 September to Thursday, at no more than 1.0, through a week of record closes. The two readings do not contradict each other: the yield is a level, while the direction reads how the Treasury group moves with the rest of the composite against its own history, and a yield can set a high for the year while that co-movement sits inside its usual range. The composite’s leading direction on Thursday grouped European utilities, gas and carbon, at 1.48, inside its range.
Book a discovery session on your own exposure →
Technology: the memory makers led on Monday, the AI suppliers on Thursday
Nvidia said on Monday 28 September that its board had authorised a further $150 billion of share repurchases, taking the remaining authorisation to $235 billion. The increase alone was worth about 2.7% of the company’s market value at Monday’s close. Micron reported record fiscal 2026 results on Wednesday 30 September. Group returns are equal-weighted averages of constituent stock returns, measured from the 24 September close to the 1 October close: the nine chip-equipment makers we follow rose 6.4%, against a 1.5% fall for the seven largest US platforms in our panel by market value.
The leading direction of our Tech panel on Monday 28 September tied two Korean memory makers to a US platform, at 2.30, outside its range. On Thursday it tied a cloud-capacity provider, a chip-design software maker and a memory maker, at 1.92, the only epicenter at Thursday’s close among the three panels whose lead we quote this week.
The audit: all four conditions persisted
Last Sunday we wrote down four things this issue would report, whichever way they went.
All nine still read in lockstep. We had asked whether all nine cybersecurity stocks were still in lockstep on 1 October, each more tightly bound to the other eight than on nine days in ten of its own history, and they were, on every session through Thursday, the fourteenth since 14 September. Their average correlation with one another over thirty sessions stayed at 0.76.
All three remain below. We had asked whether the two power producers and Oracle remained below their 11 September closes, and Constellation Energy, Vistra and Oracle closed on Thursday 9.1%, 5.7% and 8.1% under them, against 8.1%, 6.9% and 7.2% a week earlier.
Still Shock, eleventh session. We had asked whether the macro state was still Shock, and the fast layer has shown it on every session since 17 September.
Still against the chipmakers. We had asked whether cybersecurity’s thirty-session correlation with the chip-equipment makers was still below zero, and it stood at minus 0.25 on Thursday, from minus 0.19 a week earlier.
For an allocator
What follows is diagnostic and not prescriptive.
The week’s records were in rates, Treasury volatility and credit spreads, and our panel of eleven US sectors, oil and gold became more diversified while they were set, to a level not seen since March. That statement holds for the panel we measure and not for any particular book: what it means for a portfolio depends on that portfolio’s weights, which this reading does not contain. The reading also says nothing about the size of moves, and the VIX rose over the same week. Separately, the composite of 89 assets no longer reads the Treasury direction outside its usual range, in runs that receive the Treasury closes a day late.
The Shock state measures how fast conditions move, not where they go, and it has lasted eleven sessions, short of the roughly three to ten weeks that the five episodes since December 2023 lasted, from sixteen sessions in December 2023 to fifty-one from March to May 2025. Among the thirteen conditions it reads, the gap between short- and long-term Treasury rates widened by 15 basis points over the week, the largest move of the week among the rate conditions.
Before Issue #24
Issue #24 reads Thursday 8 October. Five checks for next week are set down here before the fact, and the issue will report each result.
- New York diversification, threshold 66% of the attainable: whether the panel read below 66.0 on any session from 5 to 8 October. Thursday 1 October: 67.9.
- New York directions, threshold 1.64 standard deviations: whether any resolvable direction, transmitting or absorbing, read at or above it on Thursday 8 October. Thursday 1 October: 1.32 at most.
- Macro state: whether the fast layer still reads Shock on Thursday 8 October and, if it has left, for which state.
- Investment-grade spread, threshold 100 basis points: whether any observation for 5 October or later, published through Wednesday 7 October, printed at or above it. Thursday 1 October: 86.
- Technology: whether all nine cybersecurity stocks still read in lockstep on Thursday 8 October, and whether the direction that led the Tech panel on Thursday still reads at or above 1.64. Thursday 1 October: nine of nine, and 1.92.
The ten-year Treasury yield closed at 5.28% on Friday on the Treasury’s daily curve, with the thirty-year at 5.63%, and the Federal Reserve publishes the minutes of its September meeting on Wednesday 7 October.
- The platform → econosysmographe.com/platform · Methodology → econosysmographe.com/methodology · Glossary → econosysmographe.com/glossary · contact@econosysmographe.eu
Notation annex → The measures are experimental research metrics from the Universal Risk Framework (SSRN working papers), not market standards. The diversification score is the TSS: how evenly risk is spread across the directions of a panel’s correlation structure (100% = evenly spread; low = concentrated); its zones are Singularity, Tension and Isotropic, on the dimension-normalised TSS* with thresholds at 50 and 80; all diversification percentages quoted in this article are TSS*, the score as a share of the ceiling a panel of that size can reach. The leading direction is, among the directions of co-movement the panel can resolve and that transmit stress to the others, the one whose reading is the most unusual relative to its own history, in standard deviations; it is named an epicenter only when it reads outside its usual range (1.64 or more); core / induced / periphery rank the resolvable directions. Lockstep: a stock’s curvature reading measures how tightly it is bound to the other stocks of its group through the group’s correlation structure; a stock is in lockstep when that reading exceeds the 90th percentile of its own past. The reading has no sign and says nothing about the direction of prices. The macro state has two layers: a slow one, the business-cycle phase read from the OECD composite leading indicator, and a fast one that sorts thirteen macro conditions into named regimes and overrides the slow one when conditions move quickly; the Shock state is entered after five consecutive sessions on which the shock alarm is on, and the alarm is on when the speed of those conditions exceeds its threshold, whatever their direction, or when the twenty-session change in the VIX or in the MOVE index exceeds its own 95th percentile. Readings are taken on the last settled session, Thursday; Friday’s session is read in Tuesday’s brief. Full methodology at econosysmographe.com/methodology.
Sources. U.S. Treasury, Daily Treasury Par Yield Curve Rates, 24 September to 2 October 2026. FRED: SP500, DGS10, DGS2, VIXCLS, BAMLC0A0CM (ICE BofA US corporate OAS), closes of 24 September to 2 October, and the series since March 2026. ICE BofA MOVE index closes. Cboe: VIX closes and three-month history. Bureau of Labor Statistics, The Employment Situation — September 2026, released 2 October 2026. Federal Reserve: FOMC meeting calendar for 2026 and minutes release date of 7 October 2026. NVIDIA Corporation, press release of 28 September 2026 (share repurchase authorisation), and Form 10-Q for the quarter ended 26 July 2026, SEC EDGAR. Micron Technology, Inc., Form 8-K of 30 September 2026, exhibit 99.1, SEC EDGAR. Exchange closing prices (Nasdaq, NYSE, Korea Exchange) of the stocks of the Tech panel, 11 September to 1 October 2026. OECD, Composite Leading Indicator. Econosysmographe: Global Systemic Composite SPD(89), S&P 500 SPD(13), STOXX 600 sector panel, Tech Manifold SPD(99) and its group hierarchy, Base V3. Manifold data as of Thursday 1 October 2026 close. Raw payloads on request.
Disclaimer & Regulatory Status. This document is published for sophisticated, professional, and institutional readers for informational and educational purposes only. It does not constitute investment research within the meaning of regulatory frameworks, nor is it an offer, solicitation, or recommendation to buy or sell any financial instrument. SmartGreenInvest Ltd (Reg. England & Wales No. 14636473) is not an FCA-regulated firm. All analyses are based on public quantitative data and geometric modeling as of the date of publication. Opinions expressed are subject to change without notice. Historical performance and model readings are not indicative of future results. SmartGreenInvest Ltd holds no positions in the issuers named. The author is a self-directed, long-term buy-and-hold investor in US technology equities, at a scale immaterial to the market capitalisations discussed.
By Evangelos Papadopoulos · Independent Researcher · econosysmographe.com