The S&P 500’s Worst Day Since April 2025 Wiped $450 Billion Off Nvidia. Friday Repaired the Prices, Not the Structure.
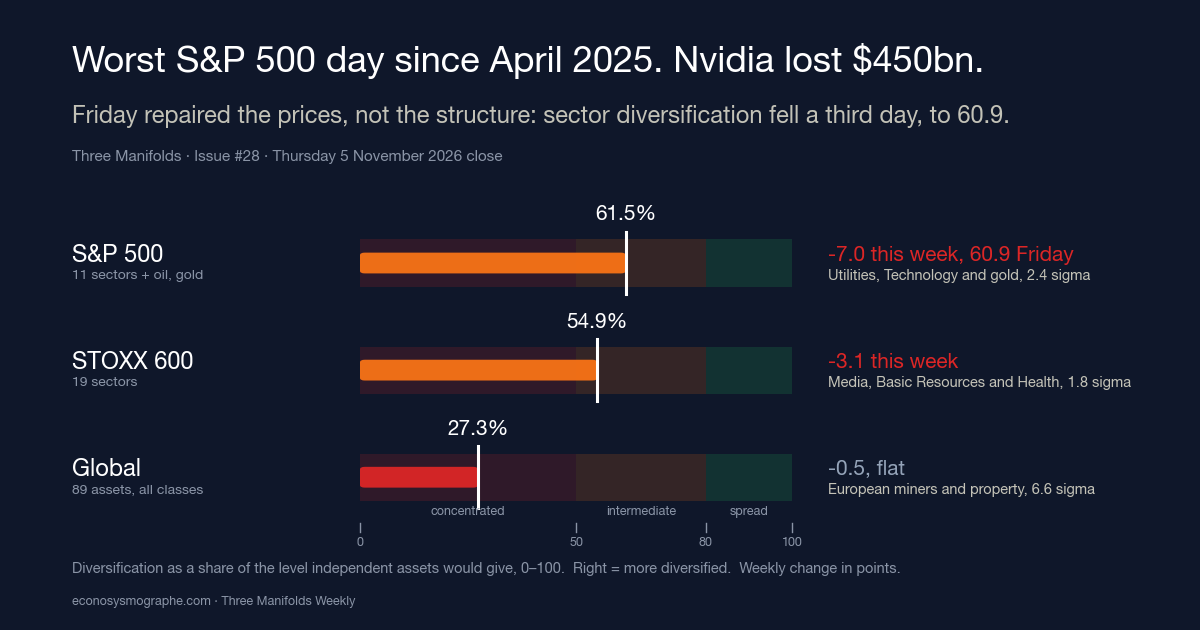
The S&P 500 fell 4.4% on Thursday 5 November, its worst day since 4 April 2025, and Nvidia lost about $450 billion of market value in the session. Friday’s rebound won back 7% of the index’s fall and 30% of the chip makers’. It did not repair the structure: our panel of eleven S&P 500 sectors, oil and gold lost diversification for a third session, to 60.9%, its lowest since 21 August, and the macro stress alarm stayed on.
Manifold data as of Thursday 5 November 2026 close · Friday 6 November as a dated observation · Market data through Friday 6 November · 10 min read
The reading in 30 seconds
Our panel of eleven S&P 500 sectors, oil and gold lost diversification on three consecutive sessions of opposite sign in prices: Wednesday’s rally, Thursday’s 4.4% decline and Friday’s rebound. From 69.1% on Tuesday to 60.9% on Friday, the fall is the largest over three sessions this year. Wednesday’s fall alone, on the rally, was the largest one-session fall of 2026. The macro stress alarm, off since 21 October, switched on on Thursday on the twenty-session rise in the VIX and stayed on on Friday, while the macro state remained Expansion.
See this reading on your own book →
The week
Thursday 5 November was the S&P 500’s worst day since 4 April 2025. The index closed at 7,353.73, down 4.4% and 335 points on the day, 4.7% below the previous Thursday and 6.0% below its record close of 6 October, 7,818.93. The Nasdaq Composite fell 5.5% to 24,315.00. Nvidia fell 9.3%, which on the share count in its latest quarterly filing and the closes of the day amounts to about $450 billion of market value, from about $4.8 trillion on Wednesday. The VIX closed at 28.18, up 70% in one session and its highest close in three months, and the VVIX, the volatility of the VIX, at 134.99. On the Treasury’s daily par curve the two-year yield fell 12 basis points to 4.46% and the ten-year 6 basis points to 4.84%, which left both 14 to 15 basis points below their closes of the previous Thursday. In London the Bank of England raised Bank Rate from 3.75% to 4.00% by eight votes to one, the dissenter preferring 4.25%, and wrote that the degree of inflationary pressure in the pipeline is now sufficient to warrant an increase. The same day Lam Research announced a $25 billion share repurchase authorisation.
The week had opened differently. Tuesday 3 November was election day in the United States. On Wednesday the S&P 500 closed at 7,688.62, up 1.6% on the day, and the VIX closed at 16.61, its lowest of the week. On the Energy Information Administration’s daily series the Brent spot price fell from $120.15 on Friday 30 October to $107.39 on Monday and $107.03 on Tuesday, the last values published before our reading. The same Wednesday Oracle closed the sale of 86.2 million shares at $116, $10 billion, and of $10 billion of notes with coupons between 7.000% and 8.650%, for general corporate purposes that may include capital expenditure, according to its Form 8-K. Qualcomm guided revenue for its first fiscal quarter to between $10.4 and $11.2 billion and wrote that the semiconductor industry is experiencing a broad-based increase in input costs. AMD had reported on Tuesday third-quarter revenue of $13.4 billion, with data-centre revenue up 97% on the year, and guided the fourth quarter to about $17 billion.
On Friday the Bureau of Labor Statistics reported that non-farm payrolls rose by 165,000 in October, against an average of 48,000 over the previous twelve months, with the unemployment rate at 4.1%, the previous two months revised up by a combined 84,000 and average hourly earnings up 3.1% on the year. The two-year yield rose 5 basis points to 4.51%. The VIX closed at 25.64, above every close of the week but Thursday’s. The MOVE index of Treasury volatility, which had risen from 93.88 on Wednesday to 97.92 on Thursday, closed at 92.77, leaving it below the 93.54 of the previous Thursday. The Nasdaq Composite rose 1.1% on the day, to 24,579.42. The S&P 500 rose too, on the close published by Yahoo Finance, the FRED series ending on Thursday at the time of writing, and by our calculation on that close it won back about 7% of the 335 points it had lost on Thursday.
Is a recession near? Nothing published this week says so. Payrolls rose by more than three times their twelve-month average, unemployment stood at 4.1%, the Bank of England raised its rate on inflation and not on weakness, and Treasury yields fell on the day equities fell, as they do when money moves into government bonds. Our own macro state read Expansion on every session, on the OECD’s leading indicator as on its fast layer, and the alarm that switched on on Thursday is an alarm about the speed of financial conditions and the rise in the VIX, not a growth signal. What the week did change is the structure of the equity market, which is what the rest of this issue measures.
New York: three sessions, three falls, two epicenters
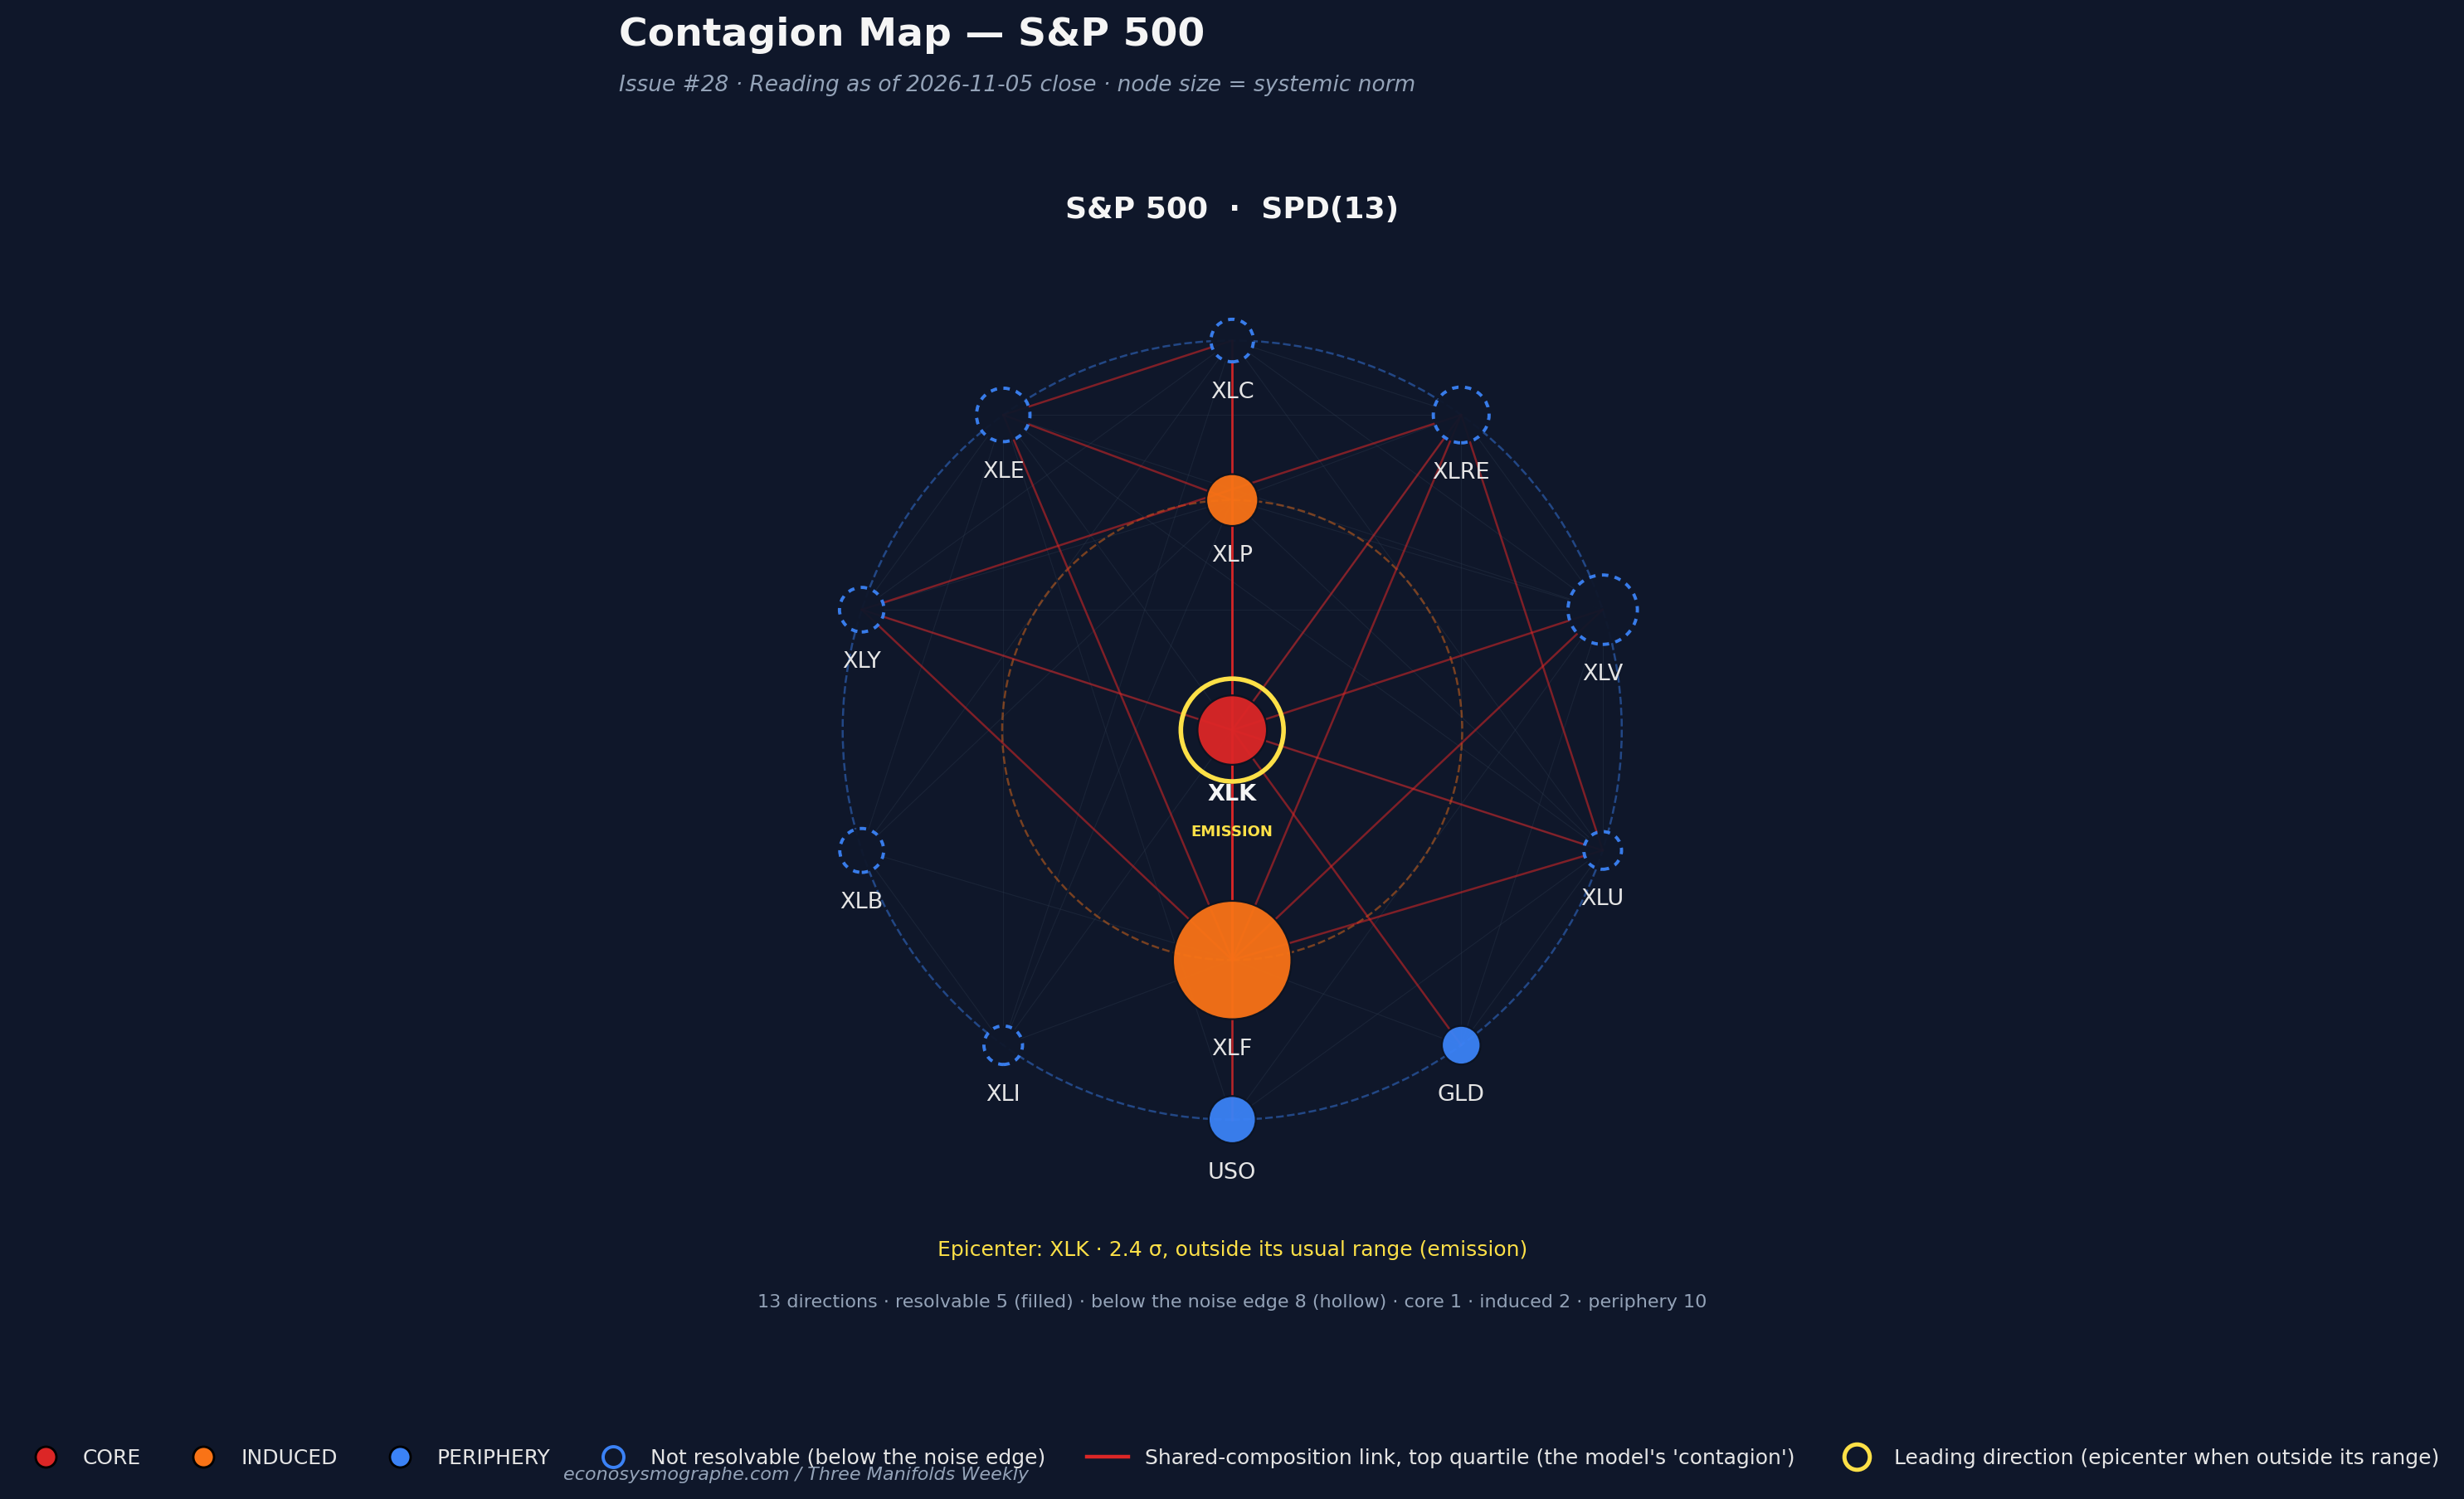
The panel’s diversification score measures how evenly its correlation structure is distributed across directions of co-movement, for thirteen assets, eleven S&P 500 sectors with oil and gold. It stood at 68.5% on the normalised scale defined in the annex on Thursday 29 October, 68.4% on Monday and 69.1% on Tuesday. On Wednesday, the day the index rose 1.6%, it fell to 63.9%, a fall of 5.2 points in one session, the largest of 2026, ahead of the 3.5 points of 8 April. On Thursday it fell to 61.5%, and on Friday, the day the index rose again, to 60.9%, its lowest since the 60.8% of 21 August. Over the three sessions the panel lost 8.1 points on the unrounded figures, more than on any three sessions of 2026.
The directions tell the three days apart. On Wednesday the direction tying the oil fund to Energy and Consumer Staples, which had already read outside its range on Monday at minus 2.87, read minus 4.59 standard deviations relative to its own history, and the model named it the panel’s epicenter. On Thursday the epicenter changed: the Utilities, Technology and gold direction read 2.41, the Industrials, Materials and Financials direction minus 2.30, both outside their range, and the oil direction had returned inside. On Friday no resolvable direction read outside its range, the Utilities, Technology and gold direction leading at minus 1.33, and the score still fell. That is the distinction the week leaves: the directional anomalies cleared on Friday, the diversification did not recover. The gold, Technology and Consumer Staples direction that had read minus 3.78 on Friday 30 October, before the window, never read above 1.63 in absolute value this week.
Europe: a fall on Wednesday, and directions outside their range on three days
The European panel of nineteen STOXX 600 sectors read 58.0% on Thursday 29 October, 57.1% on Monday and 58.1% on Tuesday, then 54.6% on Wednesday, a fall of 3.4 points in one session on the unrounded figures. It read 54.9% on Thursday and 54.4% on Friday, its lowest since 7 October. Europe showed anomalies on three days, and its score, unlike New York’s, edged up on Thursday. On Monday two directions read outside their range, Oil and Gas with Telecommunications and Technology at minus 2.07 and Media with Basic Resources and Health Care at minus 1.80. On Wednesday three did, led by the Real Estate, Utilities and Technology direction at minus 2.80, the panel’s epicenter, with Food and Beverage, Health Care and Basic Resources at 2.39 and Financial Services, Industrials and Construction at 2.03. On Thursday the Real Estate direction read minus 1.87 and the Media direction minus 1.83, the epicenter of the day. On Friday none read outside its range, the furthest being the Real Estate direction at 1.61, while the score fell again.
Under the panels: the alarm switched on on Thursday, on the VIX
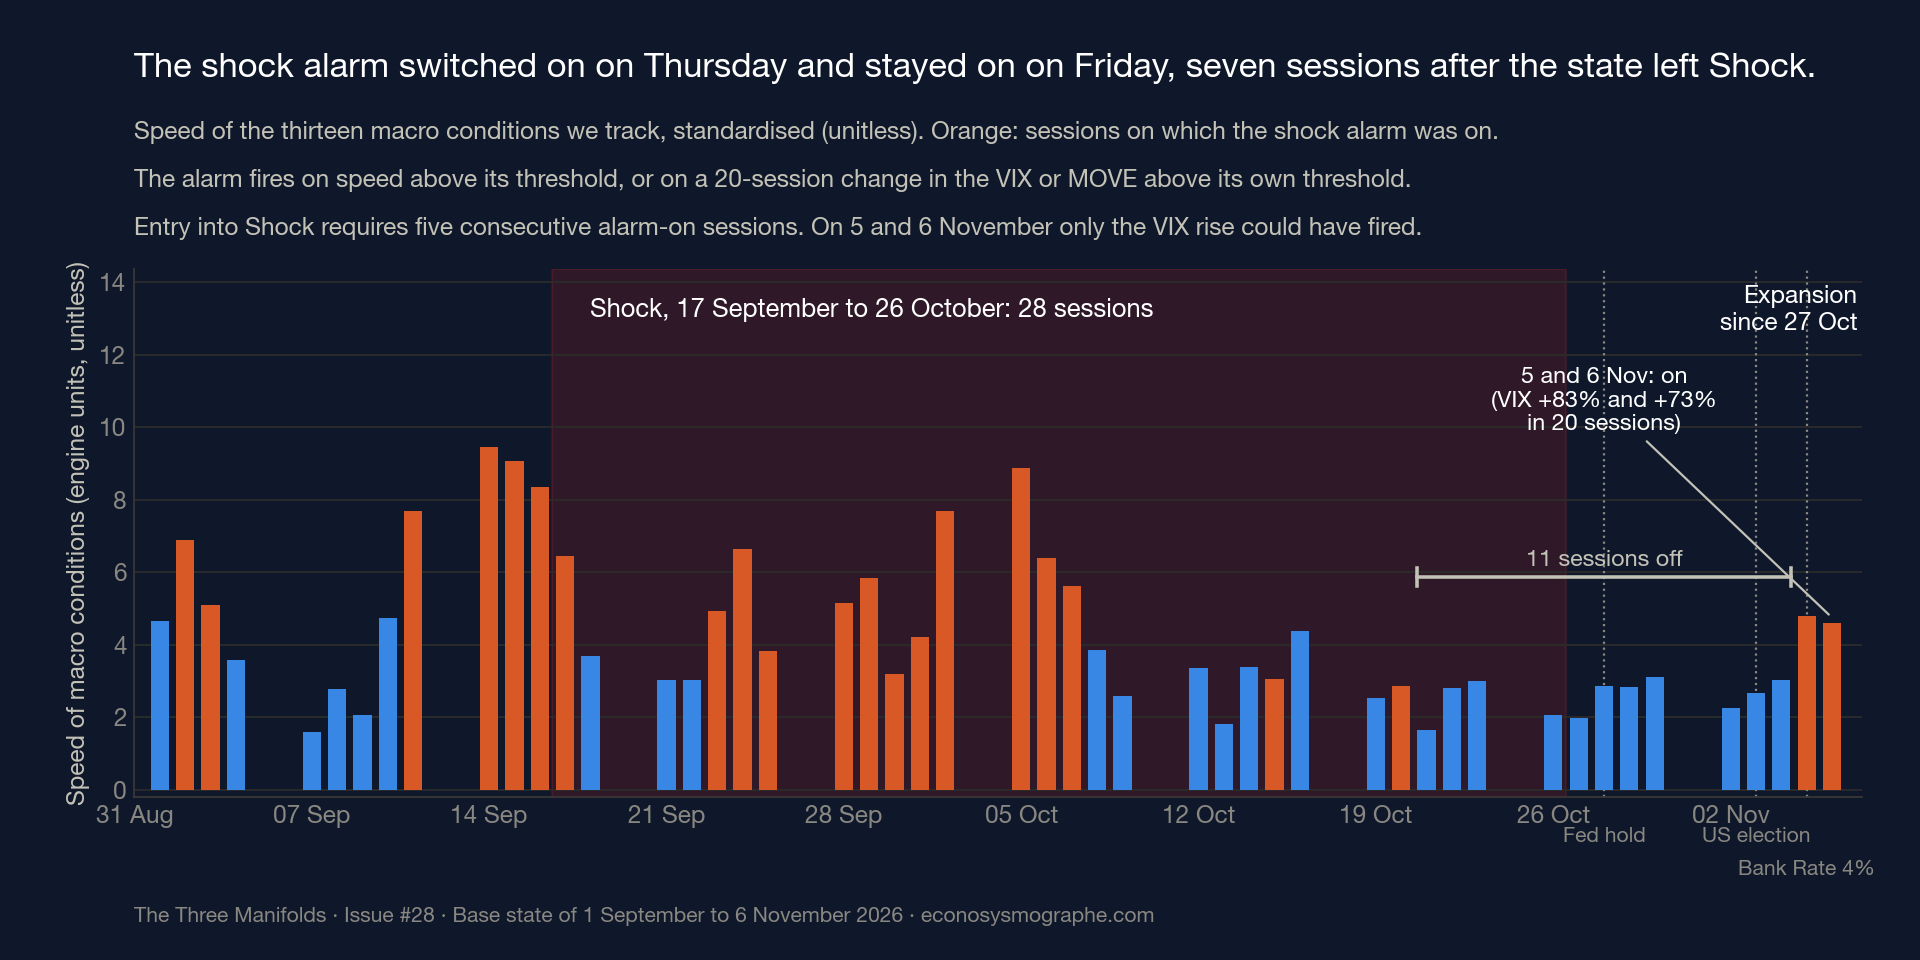
The fast layer of our macro state, which sorts thirteen conditions such as real yields, the two yield curves, volatility and the dollar into named regimes, had read Shock from 17 September to 26 October, twenty-eight sessions, the fourth longest of the six completed episodes since December 2023. It has read Expansion since Tuesday 27 October. The alarm through which Shock is entered, a separate reading from the state itself, had last been on on 20 October and stayed off on the eleven sessions from 21 October to 4 November. It switched on on Thursday 5 November and stayed on on Friday, the state reading Expansion on both days.
The alarm fires on any of three conditions: the speed of the thirteen conditions above its threshold, fixed at calibration, or the twenty-session change in the VIX or in the MOVE index above its own threshold, both measured as ratios of levels. On Thursday the VIX stood 83% above its level of twenty sessions earlier, 28.18 against 15.41 on 8 October, and on Friday 73% above, 25.64 against 14.84. The speed read 4.78 on Thursday and 4.60 on Friday, below the 4.97 of 7 December 2020 and the 4.94 of 20 April 2026, on both of which the alarm had stayed off, and the MOVE index stood 3% and 6% below its level of twenty sessions earlier. Since the thresholds are fixed and not published, the VIX condition is, by elimination, the one that fired. The state enters Shock after five consecutive sessions with the alarm on, so Wednesday 11 November is the earliest session on which it could do so, if the alarm stays on. That is the rule’s horizon, not a forecast. The business cycle, on the OECD’s leading indicator, read Expansion on every session of the week.
The composite: Treasuries inside their range, fourteen directions outside theirs
The composite of 89 assets, which reads the two sector panels together with rates, currencies, commodities and the other regions, read 27.8% on the normalised scale on Thursday 29 October, 27.4% on Wednesday, 27.3% on Thursday, its lowest since 3 June, and 27.4% on Friday. The direction that groups Treasuries stayed inside its range on every session of the week, at 1.39 at the furthest on Wednesday and 0.17 on Thursday, while the two-year yield moved 12 basis points in a session. The number of resolvable directions reading outside their range went from eight on Monday to one on Tuesday, ten on Wednesday, fourteen on Thursday and seven on Friday. On Wednesday the direction tying oil to the Energy sectors read minus 2.91, the one tying gold, silver and copper 3.39 and the one tying the carbon price to natural gas 3.48. On Thursday the furthest reading in the composite tied European Basic Resources and Real Estate to Saudi equities, at 6.59. On Friday the direction tying the two-year yield to the rupee and Turkish equities led at minus 3.02.
Technology: a broad selloff on Thursday, an uneven rebound on Friday
The technology panel’s score and directions are computed on 97 series, the 84 stocks in eight groups and thirteen macro series such as yields, the VIX and three Asian currencies. The group returns below use the 84 stocks only, as equal-weighted averages of each stock’s return between two local closes in local currency, so that Seoul’s Friday close precedes New York’s. On Thursday the 84 stocks fell 6.7% on average and 74 of them declined. The direction along which all 84 move together, with the VIX on the other side, read minus 4.59 standard deviations relative to its own history: outside its range, the panel’s epicenter, and further from its history in absolute value than on any session since our daily series of those readings begins on 27 August, the previous furthest readings being minus 2.76 on 30 October and 2.17 on 22 October. Five other directions read outside their range the same day, among them the one tying the two-year and ten-year yields to the ten-year breakeven, at 3.06, the one tying two power producers to a chip designer, at 2.47, and the one tying Tencent, SK Hynix and Samsung Electronics, at 2.42. The direction setting chips against software read 1.55, inside its range, after 1.83 on Wednesday.
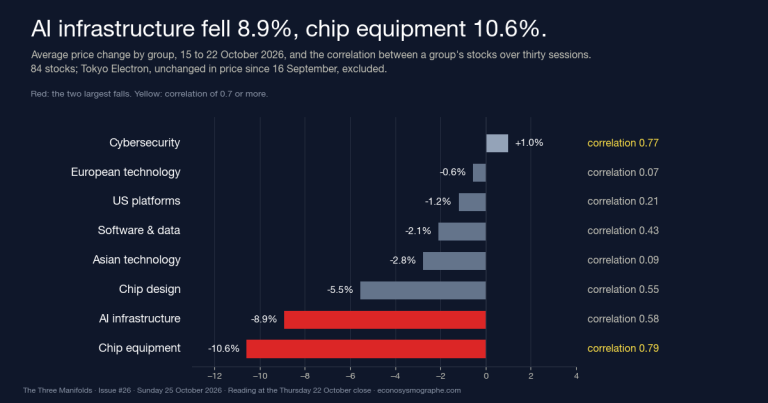
On Friday the 84 stocks rose 1.3% on average and 51 of them gained, and the common direction read 0.97, inside its range. The rebound was uneven, with the gains concentrated in AI infrastructure and the chip makers. The nine AI-infrastructure stocks returned 6.6% on average, the eight chip-equipment makers 4.2% and the fourteen chip designers 3.6%, while the thirteen US platforms returned minus 0.7%, the eleven Asian stocks minus 1.8%, with Samsung Electronics down 6.4% and SK Hynix 10.4% in Seoul, and the nine cybersecurity stocks minus 1.5%. Taken together, on the same equal-weighted convention, the twenty-two chip designers and equipment makers fell 11.4% on Thursday and rose 3.8% on Friday, recovering 30% of Thursday’s fall: their price level stood 11.4% below Wednesday’s close on Thursday evening and 8.0% below it on Friday evening.
Between the closes of 29 October and 5 November the equipment makers returned minus 22.1%, AI infrastructure minus 21.8%, the designers minus 20.3%, software and data minus 18.0%, cybersecurity minus 15.7%, the US platforms minus 3.9%, the European stocks minus 3.0% and the Asian stocks plus 1.3%, and 68 of the 84 fell on the week. AMD fell 17.3% on Thursday, two days after its report, and rose 11.0% on Friday. Lam Research fell 16.4% on Thursday, the day of its repurchase announcement, and rose 8.2% on Friday. Nvidia fell 9.3% on Thursday and rose 2.8% on Friday, TSMC fell 10.8% and rose 6.3%, and Oracle fell 17.5% between Thursdays.
The thirty-session correlation between the five hyperscalers and the AI-infrastructure group, 0.73 a week earlier, read 0.64 on Thursday and 0.62 on Friday. The spread of the 84 stocks’ five-session returns read 13.0 points on Thursday, above 99% of the sessions since July 2024, and 9.0 on Friday. The panel’s score, computed on the panel’s current composition over its whole history, fell from 54.5% on Wednesday to 53.7% on Thursday, its largest one-session fall of 2026 and its lowest since 11 August, and read 53.7% on Friday.
The audit: last week’s five checks, and the results
Last Sunday we wrote down five things this issue would report, whichever way they went, on the sessions from Monday 2 to Thursday 5 November, or on Thursday alone where last Sunday’s wording said so. Four held as written and one did not. The direction checks use absolute standardised readings, the convention by which a direction is found outside its usual range.
Common direction, held: 1.64 or more on any session from Monday to Thursday. It read 4.59 on Thursday, after 1.56, 0.51 and 0.40.
Chips against software, not held: 1.64 or more on Thursday. It read 1.55, after 1.83 on Wednesday, outside the check’s window.
Hyperscalers and AI infrastructure, held: the five platforms’ thirty-session correlation with the AI-infrastructure group above 0.60 on Thursday. It read 0.64, from 0.73.
Spread of weekly returns, held: the spread of the 84 stocks’ five-session returns above the 8.5-point threshold written down last Sunday, its 90th percentile, on Thursday. It read 13.0.
Macro state, held: the alarm on on any session from Monday to Thursday. It switched on on Thursday, with the state in Expansion.
For an allocator
What follows is diagnostic and not prescriptive. The week separated three things a risk committee can easily treat as one. The recovery of prices came on Friday. The clearing of directional anomalies came on Friday too, when no resolvable direction of the New York panel read outside its range. The recovery of diversification did not come, the panel’s score falling on the rally, the decline and the rebound alike. The question the week leaves is whether the committee’s framework tracks the three separately, and whether it makes the persistent weakness in diversification visible when prices have rebounded and no resolvable direction in the New York panel remains outside its usual range.
Before Issue #29
Issue #29 reads Thursday 12 November. Five checks for next week are set down here before the fact, each on the sessions from Monday 9 to Thursday 12 November unless stated, and the issue will report each result.
- Macro state: whether the alarm stayed on through the window, which would bring the fast layer into Shock on Wednesday 11 November, and whether it read Shock on Thursday 12, or on which session the alarm switched off. Friday 6 November: Expansion, alarm on.
- New York diversification: whether the panel read below 60.0% on any session, and whether it read 63.0% or above on any session. Friday 6 November: 60.9. Tuesday 3 November: 69.1.
- New York directions, threshold 1.64 standard deviations: whether any resolvable direction read 1.64 or more in absolute value on any session. Thursday 5 November: 2.41 and 2.30. Friday 6 November: 1.33 at most.
- Treasuries: whether the direction that groups Treasuries in the composite of 89 assets read 1.64 or more in absolute value on any session. This week: 1.39 at most, on Wednesday.
- Technology: whether the common direction read 1.64 or more in absolute value on any session, and whether the five hyperscalers’ thirty-session correlation with the AI-infrastructure group still read above 0.60 on Thursday 12 November. Thursday 5 November: 4.59 and 0.64. Friday 6 November: 0.97 and 0.62.
The Bureau of Labor Statistics publishes the October consumer price index on Tuesday 10 November and the next employment report on 4 December. The Energy Information Administration publishes its next Brent spot values on Thursday 12 November. Nvidia reports on 17 November, according to the company. The Federal Open Market Committee meets on 8 and 9 December and the Bank of England’s Monetary Policy Committee announces its next decision on 17 December. The next Tech Manifold premium issue is Sunday 6 December.
- The platform → econosysmographe.com/platform · Methodology → econosysmographe.com/methodology · Glossary → econosysmographe.com/glossary · contact@econosysmographe.eu
Notation annex → The measures are experimental research metrics from the Universal Risk Framework (SSRN working papers), not market standards. The diversification score is the TSS: how evenly the panel’s correlation structure is distributed across directions of co-movement; on the raw score, 100 would mean perfectly even and low means concentrated. All diversification percentages quoted in this article are TSS*: the raw score divided by its expected value for independent assets with the same panel size and estimation window, expressed as a percentage, so that 100% is the reference level expected for independent assets, not a hard maximum, and readings can exceed it. A weekly change under one point is called flat. The score is computed on the panel’s series, equal-weighted, and measures neither the size of any loss nor the risk of any particular portfolio. A panel of n assets has n directions of co-movement. A direction is resolvable when its weight stands above the noise edge of the panel’s spectrum, and only resolvable directions are read, each day over thirty sessions in standard deviations from its own history, in absolute value against 1.64. The leading direction is, among the resolvable directions the model classifies as transmitting stress to the others, the one whose reading is the most unusual relative to its own history. It is named an epicenter only when the absolute value of that reading is at least 1.64, signed readings keeping their sign. Transmitting and absorbing are the model’s classifications, not demonstrated transmission. In the technology panel the common direction is the first direction of the correlation structure, to which all 84 stocks contribute with the same sign and the VIX with the opposite one, which does not mean they move the same way each day. Group price changes between two dates are equal-weighted averages of each stock’s return between the two closes, in local currency. The recovery figure compounds the Thursday and Friday daily averages, a daily-rebalanced convention. The chip makers are the fourteen designers and eight equipment makers of the panel. Correlations within or between groups are computed on daily returns over thirty sessions. The spread of weekly returns is the standard deviation, across the 84 stocks, of their five-session returns on a given day, compared with the distribution of that figure over the sessions since July 2024. The macro state has two layers: a slow one, the business-cycle phase read from the OECD composite leading indicator, and a fast one that sorts thirteen macro conditions into named regimes and overrides the slow one when conditions move quickly. The Shock state is entered after five consecutive sessions on which the shock alarm is on, persists as a classification, and is left when the alarm has stayed off. The alarm is on when the speed of those conditions exceeds its threshold, whatever their direction, or when the twenty-session change in the VIX or in the MOVE index exceeds its own threshold. Readings are taken on the last settled session, Thursday. Friday’s session is read in the following run and reported as a dated observation. Full methodology at econosysmographe.com/methodology.
Sources. U.S. Treasury, Daily Treasury Par Yield Curve Rates, 29 October to 6 November 2026. Cboe, VIX and VVIX index closes, 29 October to 6 November 2026. ICE BofA MOVE index closes. FRED: SP500, closes of 29 October to 5 November 2026, and NASDAQCOM, closes of 4 to 6 November 2026. Yahoo Finance, S&P 500 close of 6 November 2026, used for the direction of Friday’s move and for our calculation of the share of Thursday’s fall recovered. U.S. Energy Information Administration, Europe Brent Spot Price FOB, daily, 30 October to 3 November 2026, release of 4 November 2026. Bank of England, Monetary Policy Summary and minutes of the Monetary Policy Committee meeting ending on 4 November 2026, published 5 November 2026. Bureau of Labor Statistics, The Employment Situation, October 2026, released 6 November 2026, and release calendar. SEC EDGAR: Advanced Micro Devices, Inc., Form 8-K of 3 November 2026. Qualcomm Incorporated, Form 8-K of 4 November 2026. Oracle Corporation, Form 8-K of 4 November 2026 and prospectus supplements of 2 and 4 November 2026. Lam Research Corporation, Form 8-K of 5 November 2026. Nvidia, press release of 28 October 2026 (third-quarter results date). Federal Reserve, FOMC meeting calendar for 2026. Bank of England, Monetary Policy Committee dates for 2026. Bureau of Labor Statistics and Energy Information Administration release calendars. Exchange closing prices (Nasdaq Stock Market, NYSE, Euronext Amsterdam, Nasdaq Helsinki, Korea Exchange, Hong Kong, Tokyo) of the stocks of the Tech panel, 29 October to 6 November 2026. OECD, Composite Leading Indicator. Econosysmographe: S&P 500 SPD(13), STOXX 600 sector panel, Global Systemic Composite SPD(89), Tech Manifold panel and its group hierarchy, Base V3. Manifold data as of Thursday 5 November 2026 close. Friday 6 November from the run of Sunday 8 November. Raw payloads on request.
Disclaimer & Regulatory Status. This document is published for sophisticated, professional, and institutional readers for informational and educational purposes only. It does not constitute investment research within the meaning of regulatory frameworks, nor is it an offer, solicitation, or recommendation to buy or sell any financial instrument. SmartGreenInvest Ltd (Reg. England & Wales No. 14636473) is not an FCA-regulated firm. All analyses are based on public quantitative data and geometric modeling as of the date of publication. Opinions expressed are subject to change without notice. Historical performance and model readings are not indicative of future results. SmartGreenInvest Ltd holds no positions in the issuers named. The author is a self-directed, long-term buy-and-hold investor in US technology equities, at a scale immaterial to the market capitalisations discussed.
By Evangelos Papadopoulos · Independent Researcher · econosysmographe.com