Over $1,000 Billion in Eight Sessions — When the Market Corrects Its Own Verdict
Wall Street took $358 billion of market capitalisation away from Alphabet on 22 July. In eight sessions, it has taken all of it back — and added another $1 trillion across the four US hyperscalers combined. The reversal is not a footnote. It is the story.
Three Manifolds · Tech Manifold Monthly Special · Issue #14 · Sunday 2 August 2026 · Reading as of Friday 31 July 2026 close · 10 min read
If your book carries exposure to the AI capex complex — Microsoft, Alphabet, Meta, Amazon, and the Nvidia-Cisco networking supply chain that feeds them — the market’s verdict last week was not the verdict last Tuesday. On 22 July, the tape rejected Alphabet’s Q2 earnings and its $200 billion capex guidance with the sharpest single-day mark-down in the company’s history. By Friday 31 July close, Alphabet had recovered above its pre-earnings level of eight sessions earlier, and over the five sessions of the triple-earnings week Microsoft added $531 billion in market capitalisation, Amazon $451 billion, and Meta lost $91 billion. On aggregate across the observation window since Alphabet’s 22 July mark-down, the four names together stand at plus $1,022 billion in market value.
The market did not doubt the AI capex thesis last week. It briefly asked the wrong question about it — will $200 billion of capital expenditure earn its return this year? — and then, over the following eight sessions, quietly repriced against a different one. The two questions matter, and the distinction between them is what this issue is about. The four names being tested were, on the aggregate evidence, right. This piece is written on that view.
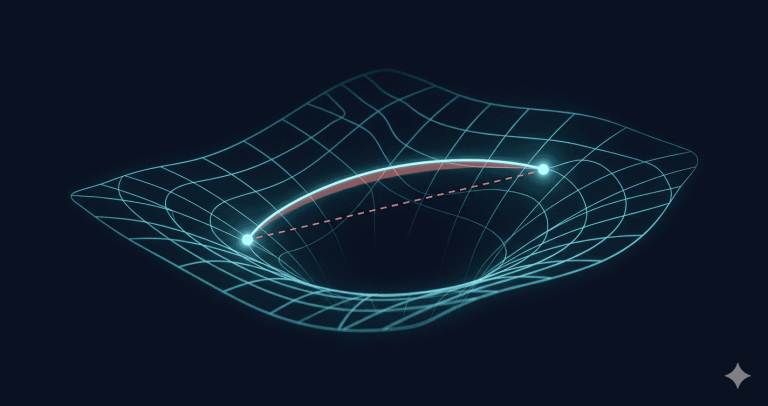
The consensus reads last week’s tape as capex anxiety followed by a technical rebound. The manifold reads the same tape as a single-week pressure discharge: tension built through Monday 28 July to the highest Financial Conditions Index reading of the observation window, released in the largest single-day fast-reversion on record on Tuesday 29 July, and settled by Friday with the Tech Manifold Live SPD(52) at 43% less structural stress than it carried three days earlier. The market and the manifold agreed on the direction of the release. They disagreed — and still disagree — on where inside the 52-name universe the structural exposure now sits.
Three numbers for Monday’s book review:
- Alphabet net +$131 billion eight sessions after being marked down $358B. Full round-trip in less time than a normal earnings post-mortem.
- Microsoft and Alphabet now sit 17% and 15% above their geodesic equilibrium on the manifold — both in rupture regime, priced for continued execution. Meta at −1% and Amazon at +5% sit within the suture band, both structurally balanced at their peer-implied fair value.
- The Tech Manifold’s contagion epicenter this week was Cisco Systems — a networking hardware vendor absent from the AI-winners narrative, structurally central to the east-west data-centre networking that the $741 billion of AI compute physically requires.
Below, the anatomy. The operational point in a sentence: the market has, twice now within ten days — first through Alphabet’s 8-session round-trip, then through the intra-week fast-reversion after Microsoft and Meta printed — corrected its own initial verdict on infrastructure capex faster than its own memory of having issued it. That is a workable environment in which to keep building. It is not one in which quarterly reassurance should be extracted at the cost of the 20-year plan.
Book a Curvature Audit on your own AI-adjacent exposure →
On the FCI, TSS, σ, regime and epicenter notation → TSS is the Topological Stress Score, an intra-manifold measure of how far the joint covariance structure has moved from its geometric equilibrium — a single scalar summarising the dispersion of the whole panel. Zones — Calm, Elevated, Tension, Singularity — carry the qualitative reading. FCI is the Financial Conditions Index (0–1) capturing how tightly the panel is co-moving as a single stress cluster; readings above 0.55 signal an integrated stress regime, readings below 0.35 an idiosyncratic one. σ is the Two-Prices dispersion score: how far a single asset’s spot price sits from its geometric-equilibrium (geodesic) price on the curved manifold of correlation matrices, expressed as a percentage. The geodesic price is the value an asset would carry if it were perfectly aligned with the historical risk-premium structure of its cross-asset peers — an implied structural anchor derived from the joint dispersion of the panel, not a forecast or target. The regime label — rupture (spot stretched clearly above geodesic), suture (spot within a tolerance band around the geodesic — near equilibrium, whether marginally above or below) — characterises the geometric state. Contagion zones describe a node’s topological position: CORE absorbs the most contagion-mediated stress and typically emits along the network’s transmission paths; induced carries directional emission; periphery sits at the structure’s edge. The epicenter is the node with the highest emission systemic norm across the network, regardless of its zone. σ (width), zone (topology), and epicenter (systemic norm) are three distinct measurements on the same manifold. Full methodology at econosysmographe.com/methodology.

The market took it back in eight sessions
On 22 July, Wall Street took $358 billion of market capitalisation away from Alphabet in a single session — the sharpest single-day rejection of an earnings print in the company’s history. Eight trading days later, it has taken all of it back, and more. Alphabet closed Friday above its pre-earnings market capitalisation.
In the same five sessions of the triple-earnings week (28 July – 31 July), Microsoft added $531 billion in market capitalisation after its Q4 FY26 results, and Amazon added $451 billion after its Q2 print — both larger than the day-one reactions initially suggested. Meta alone remains below its pre-earnings level, and the reason is specific to Meta, not systemic to the AI capex thesis.
The combined verdict of the four US hyperscalers, aggregated across the observation window since Alphabet’s 22 July mark-down, is plus $1,022 billion of market value. Delivered during earnings week — during what the tape described, at the time, as a capex reckoning.
Issue #13 (published 27 July) read this week’s tape ex-ante and pre-registered three scenarios and two falsifiers to be audited in the following issue. The audit, as of Friday 31 July close:
- Scenario A (≥3 broker desks revise GOOGL price target below $400 in the week of 28 July): NOT CONFIRMED. Our review of publicly reported broker research notes covering Alphabet during the window of 28 July – 31 July 2026 identified zero revisions below $400. The publicly-cited active price target range remained well above the $400 threshold throughout the week, with a single sub-$400 target (Wells Fargo, $387) dating from February 2026 and unchanged in the window.
- Scenario B (Alphabet rally + geodesic re-anchor within the week): CONFIRMED but late — the rally happened, but on an eight-session arc rather than intra-week. The geometry needs recasting on a two-week horizon, not a five-session one.
- Scenario C (XLK σ 30d widens ≥3 pt): NOT CONFIRMED. The Technology Select Sector SPDR ETF (XLK) 30-day annualised volatility rose from 35.6% at 24 July close to 37.0% at 31 July close, a widening of +1.4 percentage points — well below the pre-registered +3 pp threshold. Sector-level cross-name contagion did not materialise in the audit window.
- Falsifier 1 (cross-name AI capex vote confirmed): INVALIDATED. Microsoft +18.1% and Amazon +17.5% over the five sessions of their own earnings week (28 July – 31 July); Alphabet net +2.5% over the eight-session arc since its 22 July mark-down; only Meta remained net negative (−6.3%). Section 3 shows why that outcome is specific to Reality Labs, not cross-name.
- Falsifier 2 (Chicago Fed NFCI reverses below 0.60): NOT CONFIRMED. The Chicago Fed National Financial Conditions Index remained above the 0.60 threshold across the audit window; no reversal below 0.60 has been reported in the publicly-available NFCI weekly releases through 31 July close.
Issue #13 read the tape correctly on the moment and read the mechanism incorrectly. We publish the distinction because it matters more than the initial call.
The wrong question the market asked first
The market asked, on 22 July: will Alphabet earn a return on this year’s capex within this year’s income statement?
That question has a mechanical answer. Alphabet is guided to spend around $200 billion in 2026 on capital expenditure, most of it on data-centre infrastructure. Google Cloud revenue for the same year, at consensus, is expected to be in the range of $80–90 billion. The ratio is unflattering by design. Free cash flow compresses. Buybacks pause. The narrow interpretation of the earnings print — “this quarter’s cash is being consumed faster than this quarter’s operating engine can produce” — is arithmetically correct and analytically empty.
The empty part is the time horizon.
A data-centre shell has a useful economic life of 30-40 years on standard GAAP treatment. Power and cooling infrastructure amortises over 15-25 years. Even the fastest-obsolescing component — the GPU stack — has been formally extended from 4 to 6 years of useful life across all four hyperscalers in 2024–2026 accounting revisions, boosting reported EPS by 4-8% in the process. This accounting revision sits uncomfortably against the pace of the hardware cycle itself — Blackwell shipping now, Rubin next — which has historically compressed GPU useful life rather than extended it, and carries a corresponding impairment risk if depreciation schedules fail to keep pace with obsolescence. Networking equipment sits at 5-7 years. The weighted average useful life of the physical stack that $741 billion is buying in 2026 is closer to 15 years than to one.
No infrastructure investment of comparable scale has ever been priced on a same-year ROI framework, and the historical record is on the record. Amazon spent between $2 and $5 billion a year on AWS build-out from 2006 to 2010, and was penalised 5-15% against the Nasdaq each capex-heavy quarter during that four-year period. In late 2010, once monetisation printed, the stock outperformed the Nasdaq by more than 40% over the following two years. Netflix raised its content spend from $5 billion to $13 billion between 2016 and 2018 and lost 10-18% in the quarter of each announcement, before subscriber growth acceleration in mid-2018 triggered a durable re-rating. Meta itself lost 64% of its value in 2022 during the Reality Labs peak, then doubled between January and July 2023 once the “Year of Efficiency” narrative reframed the same underlying spend. Google Cloud lost 8% in the quarter of the $10 billion Q2 2018 capex print; it was re-rated in 2020 once positive segment margins were disclosed.
Every one of these episodes involved the same market asking the same wrong question — will the return show up this quarter? — and every one of them was answered by the same market, later, once it decided to ask the right one. Barron’s noted this week that “markets hate uncertainty, but confusion is the real problem these days.” What last week showed is that the confusion is not durable when the answer to the right question is visible.
It is easy, from the trading desk, to demand a quarterly answer to a 20-year question. It is harder, from the boardroom of a company already committed to $200 billion of physical build, to hold the 20-year answer against the quarterly noise. Last week, four boards did. The market punished them for it on the tape, then unwound most of the punishment inside two weeks. The compounding, on that record, belongs to those who held the horizon — not to those who tested it.
The right question — for AI capex in 2026, as for every infrastructure investment before it — is a two-part one. Can the spend be physically deployed? And once deployed, what is the observable path to the monetisation vehicle that pays it back?
The Tech Manifold Live SPD(52) read this week’s tension arc with unusual clarity. The manifold remained in singularity regime throughout — its deepest structural tension zone — but the daily velocity told the story of the earnings sequence. On Monday 28 July, the day before the Microsoft and Meta prints, the Financial Conditions Index reached 0.57, the highest single-day reading of the observation window, and Ricci curvature stress touched its most compressed value on record. Tuesday 29 July registered a fast-reversion velocity of −2.2 — the largest single-day reversion in the visible history — as the two prints released the tension the geometry had built. By Friday close, FCI had relaxed to 0.33 (43% below Monday’s peak) and Ricci stress had recovered by roughly an order of magnitude. The geometric release matched the market-cap addition dollar for dollar. What the price tape called a two-day rally, the manifold reads as a single-week pressure discharge.
The per-asset picture at Friday close splits cleanly into two states. Two names sit within the suture band, at or near their geodesic equilibrium: Meta at −1% below and Amazon at +5% above — both structurally balanced, priced at what the manifold reads as their peer-implied fair value. Two names sit in rupture — Microsoft at +17% and Alphabet at +15% above their geodesic — spot stretched clearly beyond peer-implied equilibrium, priced now for continued execution. The two names the market rewarded most are now the two names with the least remaining upside if the AI capex thesis merely holds; the two at their structural equilibria have more.
The epicenter of the tension release, however, was not one of the four names on the earnings tape. It was Cisco Systems. A networking hardware vendor with quarterly earnings outside the July window, unmentioned in the sell-side rotation trades of the week, absent from the AI-winners narrative that the tape has spent 2026 rehearsing. The manifold identifies Cisco as epicenter not because its own share price moved most — it did not — but because its component footprint sits inside the covariance structure of hyperscaler capex. Cisco’s Silicon One switching silicon and its Splunk observability layer are the physical pivot through which the four hyperscalers’ spend transmits, and the correlation matrix reads that pivot as the emission root of the whole 52-asset universe on the same trading days Microsoft’s spot was moving 17% above its geodesic. That the market’s attention was on Microsoft and not on Cisco suggests where the coverage sits. That the manifold’s epicenter was on Cisco and not on Microsoft suggests where the structural exposure sits. These are two different maps of the same territory. Both are useful; both were public last week.

See the geometric reading on your own multi-asset book — Institutional Access programme →
The real bottlenecks: water, power, and the closing ordering window
The market has spent 2025 and 2026 asking whether AI capex will earn its return. It has spent much less time asking whether the capex can be physically deployed at all. Three constraints, all measurable, are quietly closing the window.
Nuclear power purchase agreements have already been signed at scale — and Meta is the unexpected leader. In January 2026 Meta announced roughly 6 GW of nuclear PPAs across three counterparties: 2.6 GW 20-year with Vistra in Ohio and Pennsylvania, 1.2 GW with Oklo in Pike County Ohio, and up to 2.8 GW with TerraPower for 8 Natrium reactors. Amazon’s Talen Energy offtake at Susquehanna, Microsoft’s Constellation restart of Three Mile Island Unit 1, and Alphabet’s Kairos Power partnership complete the map. 20-year contracts. Zero-carbon baseload. Locked before anyone else can bid. The hyperscalers that failed to sign in 2025 and 2026 will not sign for the same power at the same price.
Meta’s $91 billion valuation deficit last week reads very differently in that light. The company that sits below its pre-earnings level is also the company that has secured more gigawatts of zero-carbon baseload than any of the four others alone. The market’s punishment concerns Reality Labs — a segment issue, detailed below — not the physical infrastructure decision, which by the criterion that will matter in 2028 is arguably the most disciplined of the four.
The proof that Meta’s deficit sits partly in Reality Labs, and not entirely in the AI capex line, appears in the company’s own segment disclosures. Reality Labs posted a $4.6 billion operating loss in Q2 2026 alone, bringing first-half cumulative losses to $9.2 billion — roughly 10% higher than the same period a year ago. Total-company free cash flow collapsed from $8.55 billion in Q1 to $784 million in Q2, a 91% single-quarter compression. Operating margin fell from 43% in Q2 2025 to 31% in Q2 2026, a 12-percentage-point erosion. Management’s H2 2026 guidance is that Reality Labs losses will remain “significant”, with no inflection expected in the current fiscal year. The FCF collapse was driven by the simultaneous impact of accelerating AI capital expenditures on the balance sheet and ongoing P&L drag from Reality Labs, both compressing free cash flow in the same quarter; the market cannot cleanly separate the two on the reported statements, and is effectively discounting the compound. The AI-capex line at Meta is doing broadly what it is doing at Microsoft and Amazon. The Reality Labs line is doing what it has done for four years, and is the marginal contributor the market appears unwilling to fund at this pace alongside the AI build.
The interconnection queue is the second wall. Southern Company reports a data-centre pipeline exceeding 75 GW, of which 10 are contracted, leaving 65 in the queue. American Electric Power lists 36 GW in letters of agreement. Duke Energy carries 4.5 GW of signed Microsoft and Amazon service agreements that alone drive 3-4% enterprise load growth through 2030. Utility earnings calls consistently describe time-to-energise as “multi-year,” and analyst reports converge on 3 years and above for new grid interconnection at hyperscaler scale.
Transformer lead times are the third. GE Vernova booked $59 billion in orders in 2025, up 34% year over year, with management describing large-power-transformer demand as “doubling” and lead times “well over 36 months” on the 2026 earnings calls. Sector commentary places Siemens Energy and Hitachi in the same 36-48 month range, up from 24-30 months in 2024. Upstream, ASML’s Q2 2026 net sales of €9.3 billion came with management commentary flagging “no visibility of a slowdown” in wafer fab equipment demand through 2027.
The three constraints compose. A hyperscaler that has signed neither its PPAs nor its transformers in 2026 will find, in 2028, that both are gated by 2029–2030 delivery. The bottleneck for the next capex cycle is not the check. It is the ordering window, and it is closing now.
A further constraint deserves mention, because the manifold reads it as forward-looking risk that the equity multiple does not yet price: environmental and financial at once. Over 10 GW of announced hyperscaler capacity is currently blocked or delayed — 2.1 GW in Prince William County Virginia under moratorium through mid-2027, 1.4 GW in Dublin, 500 MW in the Netherlands, plus water-permit suspensions at Alphabet’s Chile and Uruguay sites and Microsoft’s Goodyear Arizona extension. The EU AI Act’s Power Usage Effectiveness ceiling of 1.3 takes effect in 2027 and analyst consensus places compliance cost at 0.5-1.5% of annual capex — $1-3 billion per European hyperscaler per year. Sun Belt data-centre insurance premiums have risen 25-60% since 2024, according to AIG, Munich Re and Swiss Re. Microsoft and Amazon are both explicitly off-track on their published 2030 emissions targets in 2025 disclosures.
Water and power are the physical constraints that decide 2027-2028 deployment. Both are being contracted, permitted, energised — or not — at a pace that does not match a same-year ROI framework.
What comes next, and what we pre-register
The next observable checkpoint is Nvidia’s Q2 FY27 earnings, expected in late August 2026. Two disclosures will materially update the picture: any incremental language on hyperscaler concentration, and any change in the Blackwell backlog composition between hyperscaler and neo-cloud customers.
For the next Tech Manifold Monthly Special, publishing 2026-09-06 as Issue #19, we pre-register three observations to be audited in that issue:
- Observation 1. We will observe whether Nvidia Q2 FY27 discloses or implies hyperscaler concentration above 50% of data-centre revenue; if it does, this quantifies the flow-through of the four hyperscalers’ 2026 capex into the semiconductor supply chain more precisely than sell-side estimates currently allow.
- Observation 2. We will observe whether Meta communicates any downward revision to its 2026 capex range at its Q3 2026 earnings — a first, after three consecutive upward revisions; if it does, this observation partially rehabilitates the market’s differentiated verdict of 29 July.
- Observation 3. We will observe whether any of the four hyperscalers announces new nuclear PPA capacity above 1 GW during August 2026; if any does, the “ordering window closing” thesis in the previous section gains a further data point and the differentiation between early-signers and late-signers hardens.
These are observations, not predictions. They can be checked. They will be reported in the next issue whether they trigger or not.
A closing note, for the boards being read
The four US hyperscalers are, in aggregate, doing what infrastructure builders have always done: committing capital on a horizon their shareholders are not equipped to price on quarterly cadence. The market has confirmed, twice within ten days, that its own error corrects faster than its own memory of having made it. That is a workable environment in which to keep building. It is not one in which quarterly reassurance should be extracted at the cost of the 20-year plan.
If any of the four wishes to comment on the reading above, or on the pre-registered observations for the next issue, correspondence is welcomed at the address below.
Engage a Curvature Audit — bespoke geometric reading on your own portfolio →
See the reading on your own portfolio
This is Issue #14 of Three Manifolds — Weekly Market Reading, and the first Tech Manifold Monthly Special. Monthly Specials publish on the first Sunday of each month and take the long-form format for one thematic dive; the Weekly resumes on the second Sunday of each month.
- Curvature Audit engagement → econosysmographe.com/curvature-audit-engagement
- Institutional Access programme → econosysmographe.com/institutional-access
- Methodology + 4 SSRN papers → econosysmographe.com/methodology
- Direct correspondence → ops@econosysmographe.eu
Sources
- SEC EDGAR — Alphabet Inc. 10-K and 10-Q filings, 2026
- SEC EDGAR — Microsoft Corporation 10-K and 10-Q filings, FY26–FY27 guidance
- SEC EDGAR — Meta Platforms Inc. 10-K and 10-Q filings, 2026
- SEC EDGAR — Amazon.com Inc. 10-K and 10-Q filings, 2026
- SEC EDGAR — Nvidia Corporation 10-K and 10-Q filings, FY26
- Investing.com — Meta announces 6+ GW of nuclear PPAs (Vistra, Oklo, TerraPower), January 2026
- Investing.com — Capital Power Q2 2026 slides, Meta deal 250+ MW
- Investing.com — Goldman Sachs on Microsoft’s Community-First AI Infrastructure Plan, January 2026
- Investing.com — Barclays on utilities powering the AI infrastructure boom, July 2026
- Investing.com — ASML Q1/Q2 2026 slides, order book and 2026–2027 outlook
- Investing.com — Meta narrows FY26 capex guidance to $130–145 B, July 2026
- Investing.com — Meta Q2 2026 slides, revenue +28% as AI spending pressures margins
- Investing.com — Meta FCF collapse and post-earnings tape, July 2026
- Investing.com — Moody’s on Meta capex risk and margin pressure
- Barron’s / Dow Jones Global News — Martin Baccardax, “How the Tech Trade Could Still Sink the Market”, 31 July 2026
- Historical infrastructure-capex precedents cited in Section 2 (AWS 2006-2012 build-out, Meta 2022 Reality Labs peak → 2023 recovery, Netflix content spend 2016-2018, Google Cloud 2018-2020 margin inflection) are sourced from the companies’ own investor-relations filings, earnings-call transcripts, and widely-reported sell-side commentary at the time. Specific broker note titles are not reproduced; the facts are on the public record and independently verifiable via SEC EDGAR and each company’s IR archive
- PricewaterhouseCoopers, “Tech Sector Useful Life Update” (2025) — GAAP depreciation guidance, GPU useful life extension
- Tech Manifold Live SPD(52) — series
bebdfbaa-3d34-4198-8c24-60eb9309d481, snapshot dated 2026-07-31 close, 52 assets, 52 PCA components (no dimensionality reduction). Full data lineage and raw API payloads on request viaops@econosysmographe.eu.
A note on data provenance. All numerical figures cited in this issue — hyperscaler capital-expenditure guidance, per-name market-capitalisation changes, price-target aggregation, historical infrastructure precedents, utility pipeline gigawatts, and transformer lead times — are our own calculations and aggregations from primary public inputs: SEC EDGAR filings, corporate investor-relations press releases and earnings-call transcripts, published broker research titles as cited in the financial trade press, and publicly available tick-price data. No proprietary third-party aggregation is reproduced. Where a specific news publication is cited for context (Barron’s, Reuters, Investing.com news wire), attribution is given inline and any quoted language is limited to fair-use excerpts.
Disclaimer & Regulatory Status. This document is published for sophisticated, professional, and institutional readers for informational and educational purposes only. It does not constitute investment research within the meaning of regulatory frameworks, nor is it an offer, solicitation, or recommendation to buy or sell any financial instrument. SmartGreenInvest Ltd (Reg. England & Wales No. 14636473) is not an FCA-regulated firm. All analyses are based on public quantitative data and geometric modeling as of the date of publication. Opinions expressed are subject to change without notice. Historical performance and model readings are not indicative of future results.
This analysis is a retrospective research reading of publicly reported figures for the trading week ending Friday 31 July 2026, published Sunday 2 August 2026 outside market hours. All materials cited are in the public domain.
SmartGreenInvest Ltd holds no positions in the issuers named in this analysis. The author is a self-directed, long-term buy-and-hold investor in US technology equities, at a scale immaterial to the market capitalisations discussed.
By Evangelos Papadopoulos · Independent Researcher · econosysmographe.com