Oracle Rose 11%. Alphabet Fell 13%. On Friday 72 of 84 Tech Stocks Fell Together.
Alphabet fell 12.6% on Thursday after reporting a $9.07 billion free-cash-flow outflow for the quarter, Oracle rose 11.2% between Thursday closes after capping its further capital raises at $20 billion, and Intel lost 28.6% Friday. Intel had guided fourth-quarter revenue below the third. From Monday to Thursday, 61 of the 84 stocks in our Tech panel rose, the spread of their weekly returns stood at the 93rd percentile of the sessions since July 2024, and the direction that carries the whole sector read 0.05, inside its usual range. On Friday 72 of the 84 fell, and that direction read 2.76 in absolute value, the largest reading in our files. The structure underlying both moves was virtually unchanged.
Tech Manifold · Premium Issue · Issue #27 · Sunday 1 November 2026 · Manifold data as of Thursday 29 October 2026 close · Market data through Friday 30 October · 9 min read
The reading in 30 seconds
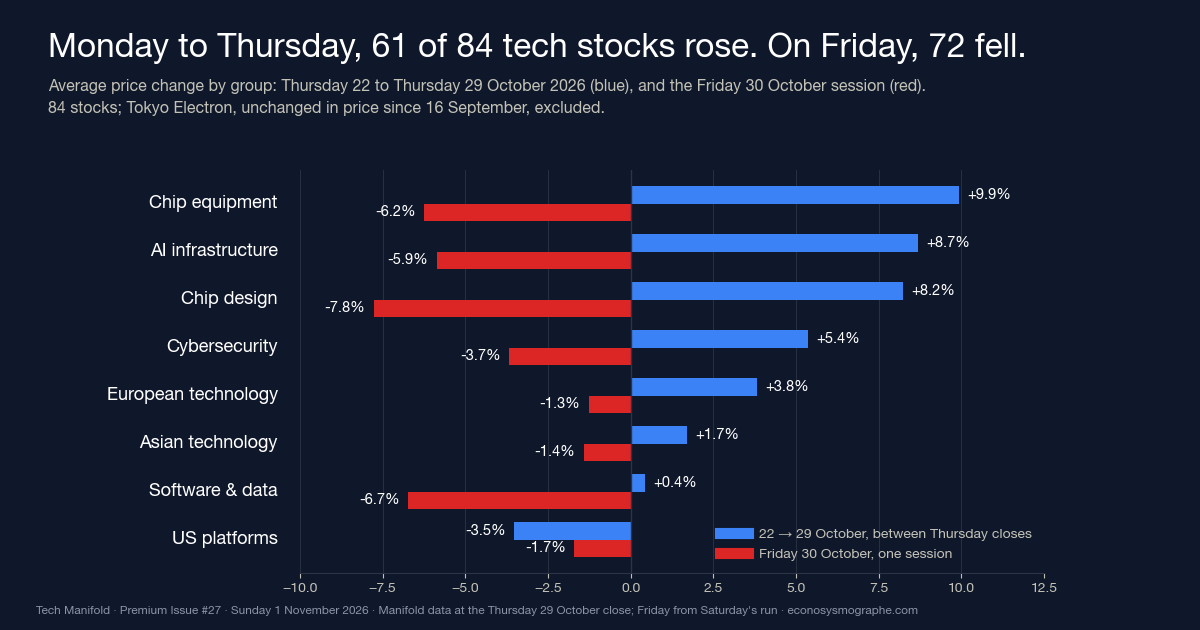
Between Thursday closes the market sorted the technology sector stock by stock. Of the 84 stocks in our Tech Manifold, 61 rose, the chip-equipment group by 9.9% and AI infrastructure by 8.7% on average after losing most since 6 October, while the thirteen US platforms lost 3.5%, pulled apart by Alphabet at minus 12.5%, Oracle at plus 11.2% and ServiceNow at minus 30.1%. On Friday, 72 of the 84 fell, by 4.3% on average.
The market did not need a new structure to move from stock-picking to a common sell-off. One common direction, to which all 84 stocks contribute with the same sign, explains 27.4% of their joint variance, as it did a week earlier, and its composition overlaps that of 22 October at 0.9999. What changed is the reading taken on it: 0.05 on Thursday, inside its usual range, after 2.17 a week earlier, then 2.76 in absolute value on Friday, its largest reading since our files begin on 7 September. The same structure produced both.
The week
Our diagnostics stop at Thursday’s close, and Friday’s closes below are quoted for context. Alphabet reported after Wednesday’s close revenue up 25% to $127.6 billion, Google Cloud revenue up 103%, a free cash flow of minus $9.07 billion for the quarter, $19.75 billion over twelve months, and net income of $26.47 billion against $34.98 billion a year earlier after an $8.66 billion loss on equity securities, the company said in its Form 8-K. Its stock fell 12.6% on Thursday, close to close. Amazon reported after Thursday’s close net sales up 12% to $201.9 billion, AWS sales up 39% to $46.0 billion and a twelve-month free cash flow of minus $42.4 billion, the company said, adding that it still expects 2026 cash capital expenditures of approximately $220 billion. Its stock had fallen 4.2% on Thursday, before the release, and fell 1.4% on Friday. Intel reported after Thursday’s close revenue up 21% to $16.5 billion, above its own guidance, and guided fourth-quarter revenue to $15.0 billion to $16.0 billion, below the third. Its stock fell 28.6% on Friday. Oracle capped its further capital raises through fiscal 2030 at $20 billion at its Investor Day on Wednesday, according to its Form 8-K. Its stock rose 10.7% that day and fell 6.4% on Friday. ServiceNow lost 26.9% on Thursday after reporting a quarter above its own guidance, according to its Form 8-K. Meta agreed to sell 40 million Class A shares under forward sale agreements at $625, or $25.0 billion, and sold $12.5 billion of 6.50% mandatory convertible preferred stock, according to the prospectus supplements it filed on 28 October.
The Federal Open Market Committee held its target range at 3.75% to 4.00% on Wednesday, with two members dissenting in favour of a quarter-point increase, according to its statement, and on the Treasury’s daily par curve the ten-year yield closed Thursday at 4.98% against 4.96% a week earlier, after 5.05% on Wednesday, and Friday at 4.94%. The Nasdaq Composite closed Thursday at 26,184.72, up 0.7% on the week on FRED, and fell 2.9% on Friday, when the Philadelphia Semiconductor Index fell 7.2% and the Cboe VIX closed at 19.42 from 17.20 on Thursday.
First, the audit: last Sunday’s five checks
- Macro, whether the fast layer left Shock: yes, on Tuesday 27 October, after 28 sessions, and the alarm was off on Thursday.
- New York, floor at 66 and a Thursday at 70: held and not reached, never below 66% and 68.5% on Thursday.
- New York, the gold direction on Thursday and any direction on any session: no and yes, minus 0.04 on Thursday, and an oil, Energy and Health Care direction at 2.12 on Monday 26 October.
- Treasuries at 1.64 in absolute value on any session: no, 0.02 at most.
- Technology, the common direction at 1.64 on any session from Monday to Thursday: no, 0.05 at most. Chip equipment against software on Thursday: 0.01, inside. The five platforms’ correlation with AI infrastructure above 0.60: yes, 0.73. Friday’s 2.76 is a separate observation outside the window.
Eight groups: the week sorted them
The Tech Manifold follows 85 technology stocks in eight groups, read each week with thirteen macro series. This week 84 were usable, Tokyo Electron being excluded for a price series unchanged since 16 September. The sector’s diversification score read 54.7% on Thursday against 54.6% a week earlier, flat under our one-point rule. It describes how the sector’s correlation structure is shared out across directions of co-movement, not the size of any loss.
| Group | Stocks | Price change, 22 → 29 Oct | Stocks up, 22 → 29 Oct | Price change, Friday 30 Oct | Price change, 6 → 30 Oct | Correlation between members, 30 sessions, 29 Oct (22 Oct) |
|---|---|---|---|---|---|---|
| Chip equipment | 8 | +9.9% | 7 of 8 | −6.2% | −22.0% | 0.72 (0.79) |
| AI infrastructure | 9 | +8.7% | 9 of 9 | −5.9% | −21.5% | 0.56 (0.59) |
| Chip design | 14 | +8.2% | 13 of 14 | −7.8% | −14.7% | 0.54 (0.55) |
| Cybersecurity | 9 | +5.4% | 8 of 9 | −3.7% | −2.4% | 0.66 (0.77) |
| European technology | 10 | +3.8% | 7 of 10 | −1.3% | +1.5% | 0.10 (0.07) |
| Asian technology | 11 | +1.7% | 5 of 11 | −1.4% | −6.3% | 0.07 (0.09) |
| Software & data | 10 | +0.4% | 6 of 10 | −6.7% | −7.8% | 0.44 (0.43) |
| US platforms | 13 | −3.5% | 6 of 13 | −1.7% | −5.1% | 0.14 (0.22) |
84 stocks, Tokyo Electron excluded. Returns are equal-weighted averages of each stock’s return between the two closes. Correlations are averages of pairwise correlations of daily returns within each group.
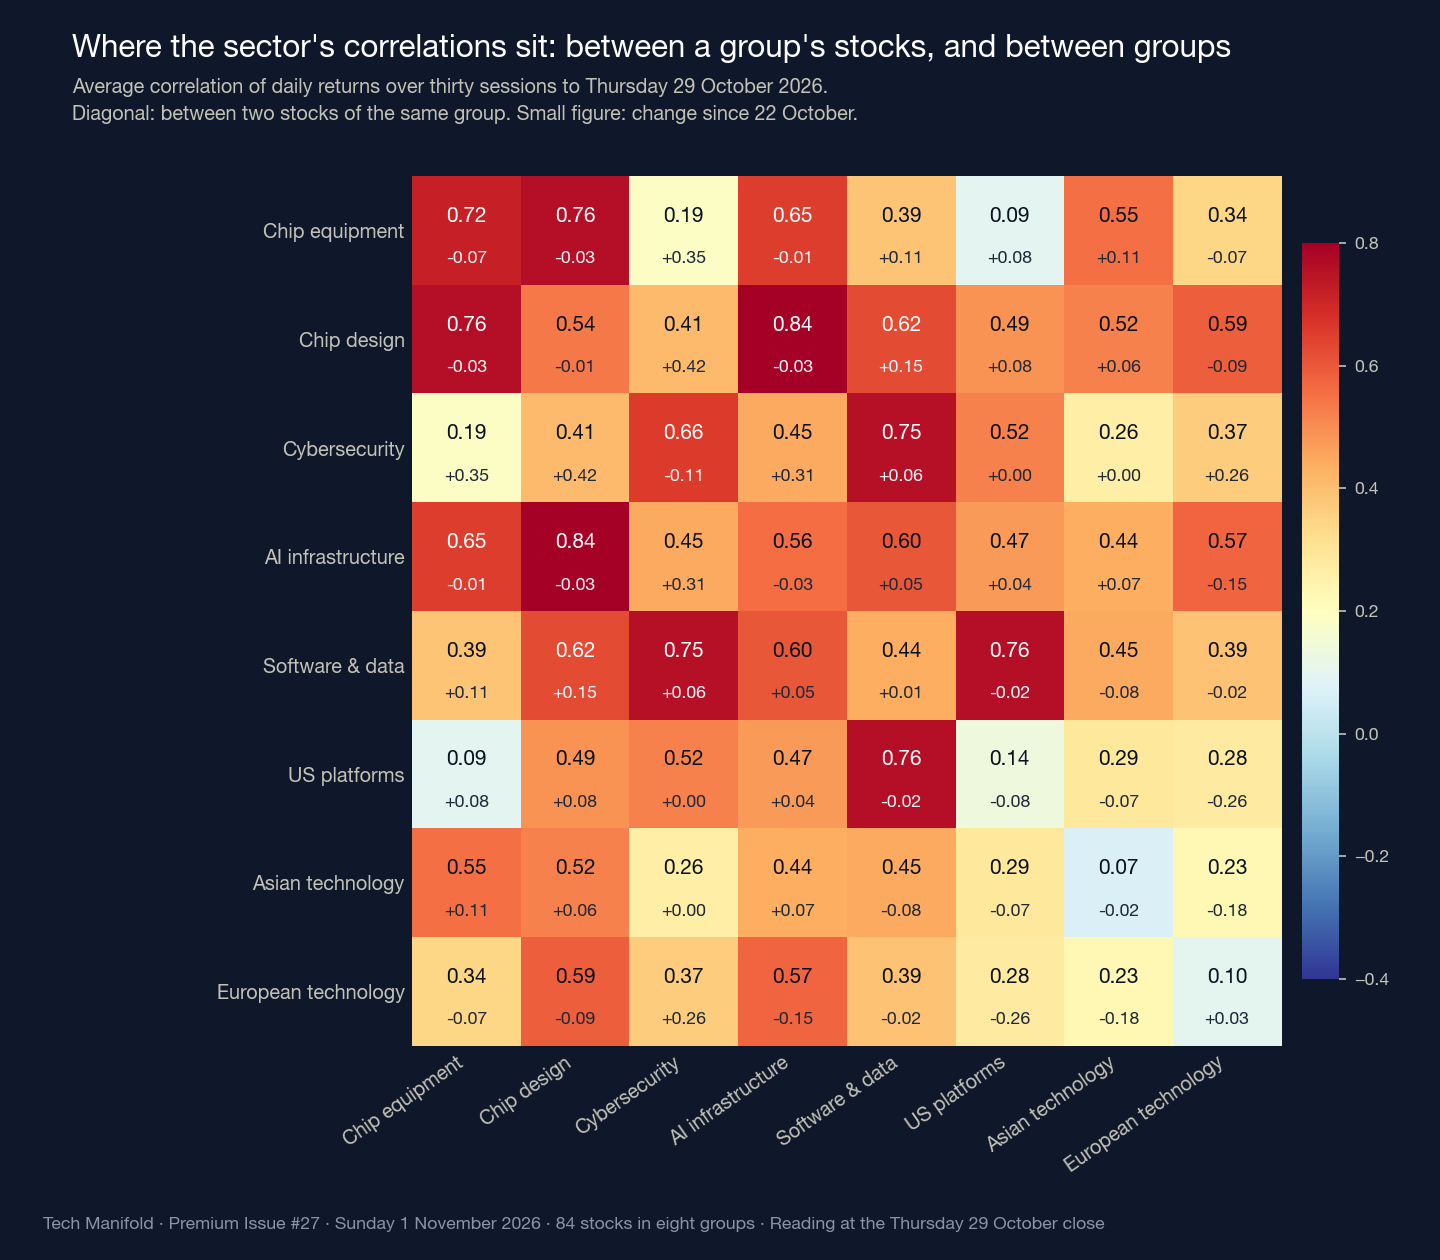
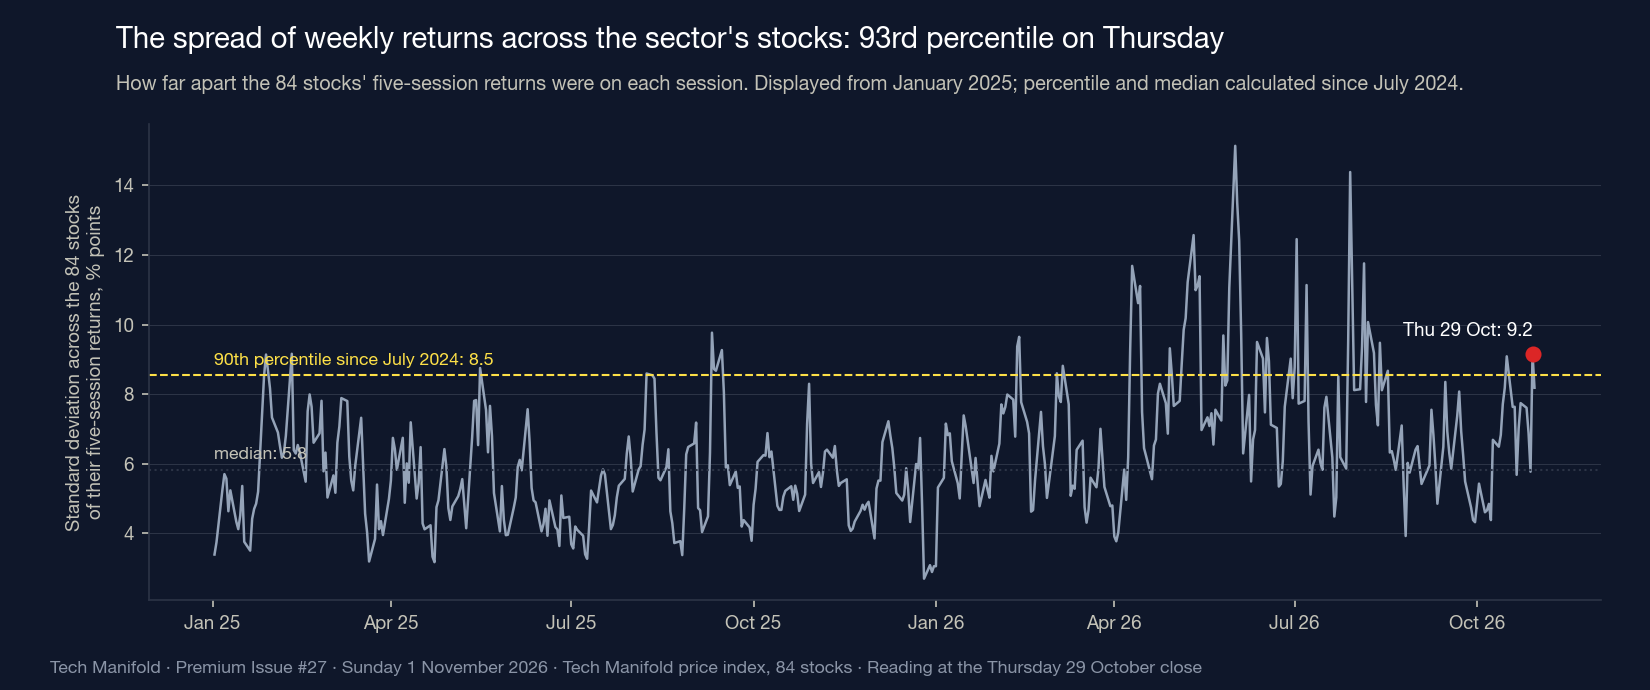
The groups that had lost most since 6 October rose most between Thursdays. The only group to fall, the platforms, fell because its members went opposite ways, a spread of 41 points between Oracle and ServiceNow, and the correlation between the thirteen platforms fell to 0.14 from 0.22. Across the whole panel, the spread of the 84 stocks’ five-session returns, measured as their standard deviation across stocks, stood at 9.2 percentage points on Thursday against a median of 5.8 since July 2024, the 93rd percentile of those 589 sessions. The five platforms with the largest capital spending in the group, Meta, Alphabet, Amazon, Oracle and the platform that reported $58.0 billion of operating cash flow on Wednesday, moved less together, their correlation falling to 0.37 from 0.46 over thirty sessions, while the correlation of their average daily move with the AI-infrastructure group’s read 0.73 against 0.71. On the atlas below, the chip designers and the AI-infrastructure names moved together at 0.84, the platforms and software at 0.76, and the platforms and the equipment makers were nearly uncorrelated at 0.09.
Want the full detail, stock by stock? Order the detailed report →
What companies reported as the market split
Three pairs appeared in one week. Alphabet’s purchases of property and equipment, $51.36 billion, exceeded its net cash from operations, $42.29 billion, for the second quarter running, and its stock lost 12.6% in the session after the filing. Amazon’s twelve-month free cash flow stood at minus $42.4 billion, “driven primarily by a year-over-year increase of $94.8 billion in purchases of property and equipment”, the company said, and its stock lost 1.4% in the session after the filing. A third platform reported on Wednesday $58.0 billion of net cash from operations against $39.37 billion of additions to property and equipment, 1.5 times, and its stock rose 1.7% between Thursdays. Oracle, which had sold $20 billion of its own shares in its first fiscal quarter, said it would raise at most $20 billion more through fiscal 2030, half of it in equity. Its shares rose 10.7% on Wednesday, the day of its Investor Day, before falling 9.6% over the next two sessions. Meta arranged $37.5 billion of equity financing in a week, $25.0 billion of it sold forward with about $24.9 billion to be received on settlement by November 2027, and its stock fell 3.7% between Thursdays. Our reading makes no judgement on the credit of any of these companies, and three observations are not a rule.
The same structure produced both
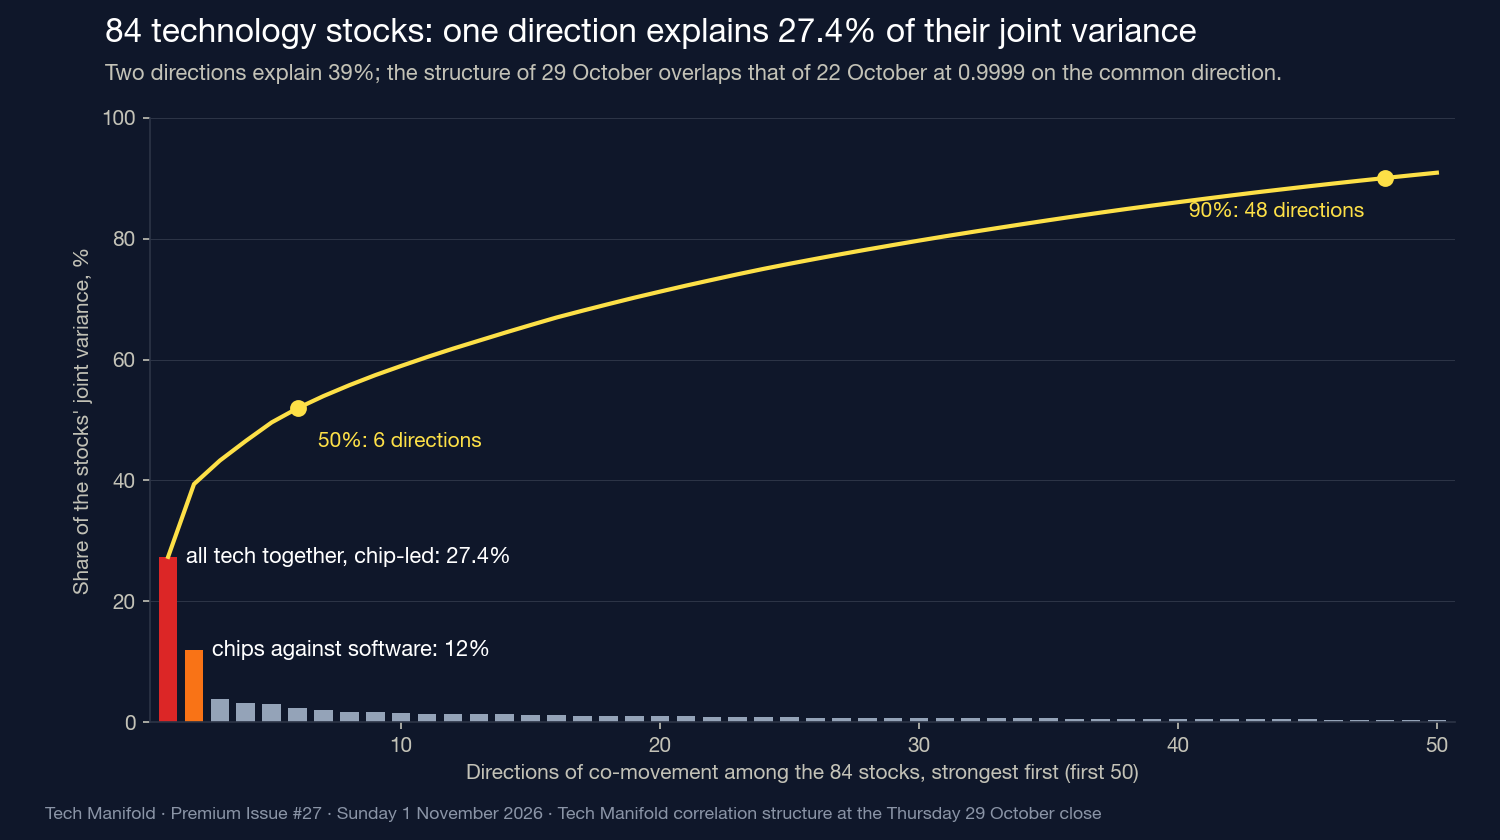
The strongest direction among the 84 stocks is the sector as a whole: every stock enters it with the same sign and the VIX against them. It explains 27.4% of their joint variance against 27.5% on 22 October, and the chipmakers carry it most, chip design for 26.6% of its weight and chip equipment for 15.0%, ahead of the platforms at 13.1%. The second direction, with 12.0%, sets the chip-equipment makers against software. Six directions explain half the joint variance and 48 explain 90%, as on 22 October, and the common direction of Thursday overlaps that of 22 October at 0.9999. Nineteen of the panel’s 97 directions can be told apart from statistical noise.
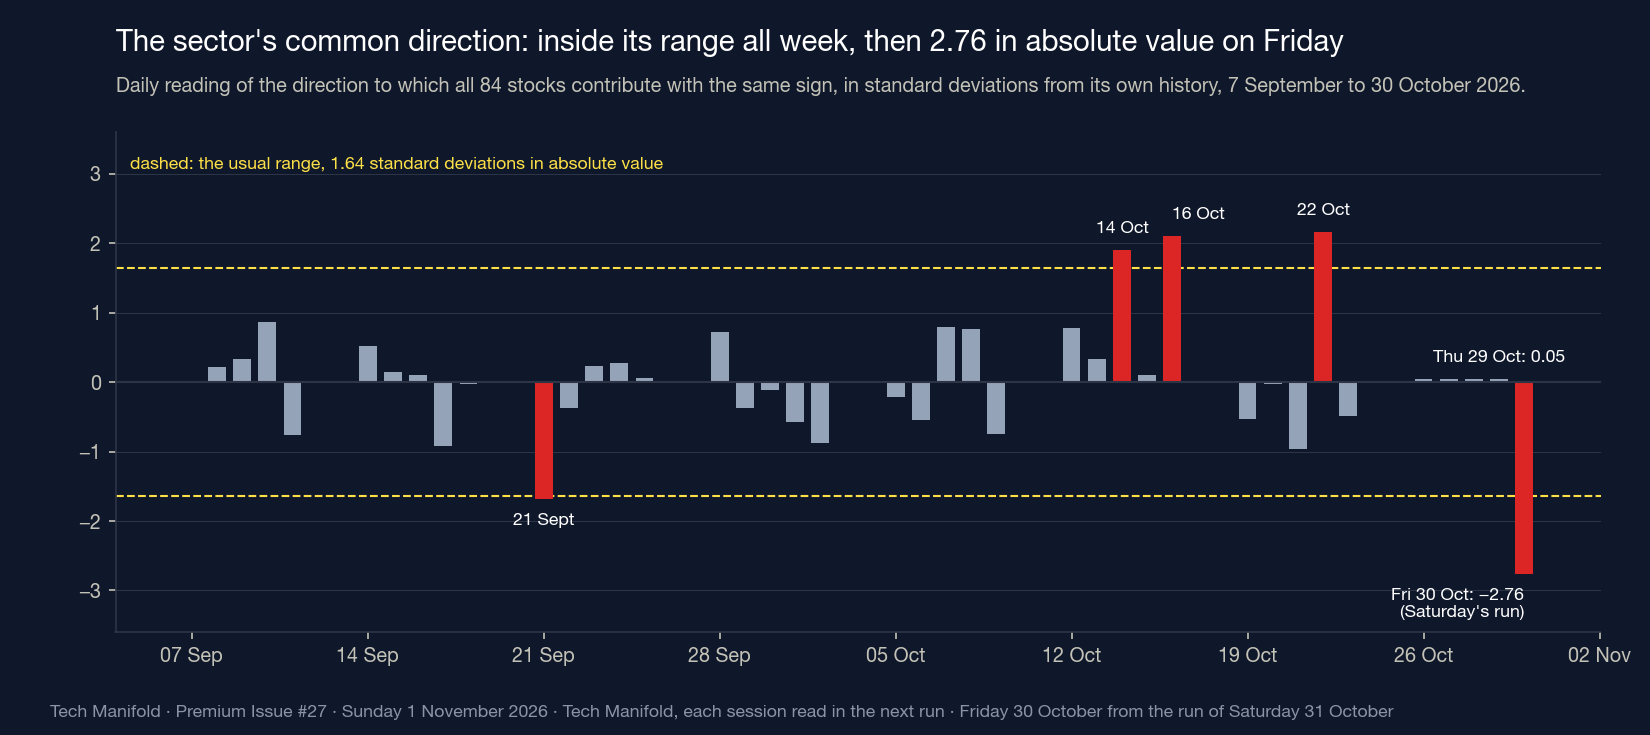
What moved is the reading taken on that fixed structure. The common direction, read each day over thirty sessions in standard deviations from its own history, had read 1.90 on 14 October, 2.11 on 16 October and 2.17 on 22 October, outside its usual range of plus or minus 1.64 all three times. From Monday 26 to Thursday 29 October it read between 0.04 and 0.05, and the chips-against-software direction read 0.01 on Thursday against 2.78 a week earlier. No resolvable direction of the panel read outside its range on any of the four sessions: the week’s moves, large as they were stock by stock, did not line up along any direction the structure holds.
Friday, in Saturday’s run
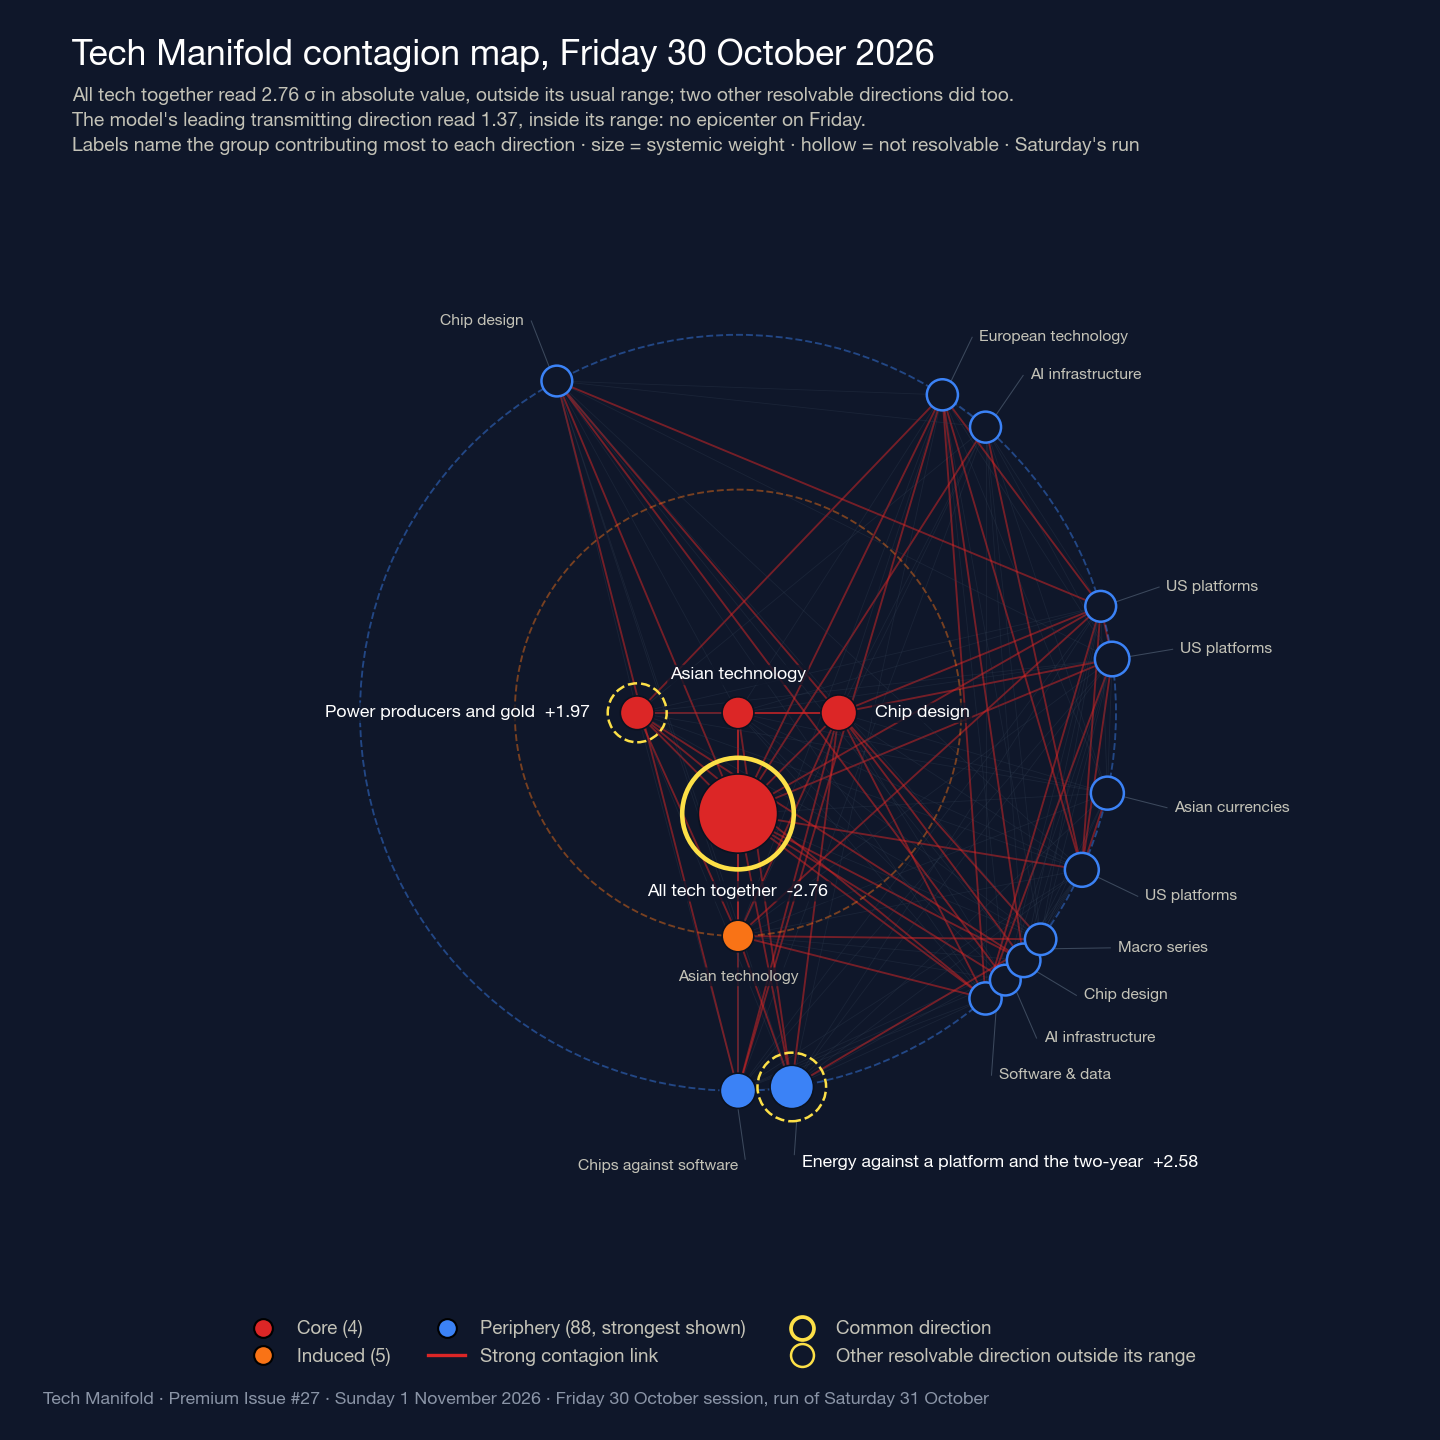
Friday lies outside this issue’s reading window, which closes on Thursday, and is reported here as a dated observation from the run of Saturday 31 October, which carries Friday’s closes. On that day 72 of the 84 stocks fell, by 4.3% on average. Chip design fell 7.8%, software and data 6.7%, chip equipment 6.2% and AI infrastructure 5.9%, with no stock rising among the chip designers, the equipment makers and the AI-infrastructure names. The common direction read minus 2.76, outside its range, in absolute value the largest reading in our files, its fourth outside the range since 14 October after one in the five weeks before. Its composition had not moved: Friday’s common direction overlaps Thursday’s at 1.0000. Two other resolvable directions left their range on Friday, one setting energy against a US platform and the two-year yield at 2.58, and the power producers with gold at 1.97. The model classified all three as absorbing stress rather than transmitting it. Its leading transmitting direction, tying the Korean memory makers to a US platform, read 1.37, inside its range, so the panel named no epicenter on Friday.
For an allocator
What follows is diagnostic and not prescriptive. An investor holding a broad basket of technology stocks could have seen sharply differentiated returns through Thursday, with 61 of the 84 stocks in our panel up and the platforms correlated at 0.14, only for common sector exposure to dominate Friday’s decline, when 72 of the 84 fell. Diversification of outcomes on one day is not diversification of structure. For a risk committee, the question the week leaves is which of the two days its limits were written for, since the common direction’s composition was virtually unchanged between Thursday and Friday.
Before Issue #28
Issue #28 reads Thursday 5 November. Five checks on the sessions from Monday 2 to Thursday 5 November, each with its reference reading of Thursday 29 October. Friday 30 October is already in our files and is left out of the windows.
- The common direction at 1.64 or more in absolute value on any session from Monday to Thursday. Reference: 0.05 on Thursday, and 2.76 on Friday, already in the files.
- The chips-against-software direction at 1.64 or more in absolute value on Thursday 5 November. Reference: 0.01.
- The five platforms’ correlation with the AI-infrastructure group above 0.60 on Thursday 5 November. Reference: 0.73.
- The spread of the 84 stocks’ five-session returns above its 90th percentile, 8.5 points, on Thursday 5 November. Reference: 9.2.
- The macro state: whether the alarm is on on any session, and the state on Thursday 5 November. Reference: Expansion since 27 October, alarm off. A return to Shock needs five consecutive sessions with the alarm on and cannot occur inside the window.
Eurostat publishes its flash estimate of euro-area inflation on Wednesday 4 November and the Bureau of Labor Statistics its employment report on Friday 6 November, after the window, according to their calendars. The Federal Open Market Committee next meets on 8 and 9 December.
Method and data
Panel. The Tech Manifold holds 98 series: 85 technology stocks in eight groups (chip equipment, chip design, AI infrastructure, cybersecurity, software and data, US platforms, Asian technology, European technology) and thirteen macro series (US yields at three months, two and ten years, the ten-year breakeven, the VIX, the dollar index, the high-yield credit spread, gold, Brent, an energy equity index and three Asian currencies). Thursday’s run retained 97, Tokyo Electron’s series being unchanged since 16 September and excluded from every group figure in this issue. Prices are exchange closes, and the group hierarchy is the one in force since 14 October.
Readings. The correlation structure is estimated on the panel’s history since July 2024. Its directions are the eigenvectors of that structure, read each day over thirty sessions in standard deviations from their own history, in absolute value against 1.64. The share of joint variance quoted for the common direction is the first eigenvalue of the 84-stock block of that structure over the block’s trace. The overlap between two dates is the absolute cosine of the direction’s loadings on the series common to both, and a group’s weight in a direction is the share of the direction’s squared loadings carried by the group’s stocks. Group price changes are equal-weighted averages of each stock’s return between two closes. Correlations within a group are averages of pairwise correlations of daily returns over thirty sessions, and between groups the linear correlation of the two groups’ average daily returns over the same window. The spread of weekly returns is the standard deviation, across the 84 stocks, of their five-session returns on a given day, compared with the distribution of that figure over the 589 sessions since July 2024.
Timing. Readings are taken on the last settled session, Thursday. This week Thursday’s session was read in Friday evening’s run and Friday’s session in Saturday’s, which is why Friday appears as a dated observation and not in the audit. The five checks published last Sunday are read on the sessions of Monday to Thursday only, Friday 23 October having already been in the files when they were written.
See which of your own positions move as one →
- The platform → econosysmographe.com/platform · Methodology → econosysmographe.com/methodology · Glossary → econosysmographe.com/glossary · contact@econosysmographe.eu
Notation annex → The measures are experimental research metrics from the Universal Risk Framework (SSRN working papers), not market standards. The diversification score is the TSS: how evenly the panel’s correlation structure is distributed across directions of co-movement (100% = evenly spread; low = concentrated); all diversification percentages quoted in this article are TSS*, the score as a share of the ceiling a panel of that size can reach, and a weekly change under one point is called flat. The score is computed on the panel’s series, equal-weighted, and measures neither the size of any loss nor the risk of any particular portfolio. A direction is an eigenvector of the panel’s correlation structure (97 series on Thursday); the common direction is the first of them, to which all 84 stocks contribute with the same sign and the VIX with the opposite one, which does not mean they move the same way each day. A direction is resolvable when its eigenvalue lies above the noise edge of a random matrix of the same shape, and only resolvable directions are read. The leading direction is, among those the model classifies as transmitting stress, the one whose reading is the most unusual, and it is named an epicenter only when the absolute value of that reading is at least 1.64. Transmitting and absorbing are the model’s classifications, not demonstrated transmission. The macro state has two layers: a slow one, the business-cycle phase read from the OECD composite leading indicator, and a fast one that sorts thirteen macro conditions into named regimes; the Shock state is entered after five consecutive sessions on which the shock alarm is on, persists as a classification, and is left when the alarm has stayed off; the alarm is on when the speed of those conditions exceeds its threshold, whatever their direction, or when the twenty-session percentage change in the VIX or in the MOVE index exceeds its own 95th percentile. Full methodology at econosysmographe.com/methodology.
Sources. U.S. Treasury, Daily Treasury Par Yield Curve Rates, 22 to 30 October 2026. Federal Reserve, FOMC statement of 28 October 2026 and meeting calendar for 2026. Bureau of Labor Statistics and Eurostat, release calendars. FRED: NASDAQCOM, DGS10, VIXCLS, closes of 22 to 29 October 2026. Nasdaq Composite and Philadelphia Semiconductor Index closes of 30 October 2026 (exchange data). Cboe: VIX closes. SEC EDGAR: Alphabet Inc., Form 8-K of 28 October 2026; Amazon.com, Inc., Form 8-K of 29 October 2026; Microsoft Corporation, Form 8-K of 28 October 2026; Intel Corporation, Form 8-K of 29 October 2026; Oracle Corporation, Form 8-K of 28 October 2026; Meta Platforms, Inc., Form S-3ASR of 26 October, prospectus supplements of 28 October and Form 8-K of 29 October 2026; ServiceNow, Inc., Form 8-K of 28 October 2026. Exchange closing prices (Nasdaq, NYSE, Nasdaq Helsinki, Euronext Amsterdam, Korea Exchange, Hong Kong, Tokyo) of the stocks of the Tech panel, 6 to 30 October 2026. OECD, Composite Leading Indicator. Econosysmographe: Tech Manifold panel (98 series, 97 in Thursday’s run), S&P 500 SPD(13), Global Systemic Composite SPD(89), Base V3. Manifold data as of Thursday 29 October 2026 close; Friday 30 October from the run of Saturday 31 October. Raw payloads on request.
Disclaimer & Regulatory Status. This document is published for sophisticated, professional, and institutional readers for informational and educational purposes only. It does not constitute investment research within the meaning of regulatory frameworks, nor is it an offer, solicitation, or recommendation to buy or sell any financial instrument. SmartGreenInvest Ltd (Reg. England & Wales No. 14636473) is not an FCA-regulated firm. All analyses are based on public quantitative data and geometric modeling as of the date of publication. Opinions expressed are subject to change without notice. Historical performance and model readings are not indicative of future results. SmartGreenInvest Ltd holds no positions in the issuers named. The author is a self-directed, long-term buy-and-hold investor in US technology equities, at a scale immaterial to the market capitalisations discussed.
By Evangelos Papadopoulos · Independent Researcher · econosysmographe.com