Covid-19: What Market Geometry Revealed While Stock Indices Hit Record Highs
Value-at-risk sizes the loss. It does not count how many independent directions a book has left. A retrospective replay of 2020 on the correlation matrix of a seventeen-asset panel counts them: a fifth fewer at the February record, 79% gone in twenty sessions, a floor three sessions before the S&P 500’s, and four years to regain the January peak. The virus was unforeseeable. The dimensionality of the system it hit was measurable at every close.
Issue #17 · Sunday 23 August 2026 · Retrospective replay, 2019–2021 · 11 min read
The reading in 50 seconds
On 19 February 2020 the S&P 500 closed at a record. That day, the capacity of a seventeen-asset US panel to diversify — its Topological Survival Score — read 30.9%, down from 39.4% on 10 January. The index had gained 3.7% in six weeks. The structure under it had lost a fifth. Then Italy locked down eleven towns, and in twenty sessions the score fell a further 79%, to 6.4%. On 9 March, the day of the first circuit breaker, the structure made its largest move of a six-year replay — with the index still 18.5% above its low. The geometry bottomed on 18 March; the S&P 500 on 23 March. The index was back at a record by 18 August. The structure had recovered half of its January capacity by 2 September — 117 sessions after the floor, nearly six times the length of the fall.
None of this was published in 2020; the instrument did not exist. This is a replay, and its claim is narrow: the trigger was exogenous, the transmission was not. The tape reported a price. The geometry reports a position, a speed and a recovery clock — three readings the price never carried.
See how much diversification your own book carries today — book a 30-minute discovery session →
What this is, and what it is not → A retrospective replay: the production engine run on a fixed seventeen-asset panel — nine S&P 500 sector ETFs, the S&P 500 and Nasdaq Composite, GLD, TLT, VIX, the US 10-year yield, the US high-yield option-adjusted spread and EUR/USD — over 2019–2021, on a rolling 60-session correlation matrix of the seventeen series (log-returns for prices, first differences for the yield and the spread), read as a point on SPD(17). Every reading at date t uses only data up to t. The panel was chosen after the fact, with full knowledge of what happened, which is why this piece claims no foresight: it is not a record of readings issued at the time, not a backtest of a strategy, not a forecast. The seventeen assets are a standard cross-asset US set — the nine S&P 500 sectors, the two headline indices, the classic refuges (gold, long Treasuries, implied volatility), rates, credit and the dollar — fixed in advance, not screened to produce the result. The three measures below are experimental research metrics proposed by the author in the Universe Risk Framework (SSRN working papers); they are not established market standards such as value-at-risk or volatility, and are defined here only so the reading is self-contained. TSS is the Topological Survival Score (URF-2, SSRN 6140809): the ratio of the geometric to the arithmetic mean of the panel’s correlation spectrum, in percent — 100% when risk is spread evenly across every direction of the structure, falling toward zero as it concentrates onto a few. Dp is the Papadopoulos Distance of the correlation structure from perfect diversification (the identity matrix) on the SPD(17) manifold, ‖ln λ(Σ)‖₂; velocity is its change per session (geodesic velocity). FCI is the Flash Condition Index (0–1), a purely geometric composite that uses no price movements. TSS levels on this panel are not comparable with the live weekly panels. Full definitions in the glossary; methodology at econosysmographe.com/methodology.

What the geometry reads that the price does not
A price index carries one number a day, and from it a return. Everything a conventional risk framework produces — volatility, value-at-risk, drawdown — is a statistic of that one series, or of a table of them. The geometric reading starts from the same table of returns and takes a different object from it: the covariance matrix of the panel, standardised to unit variance so that no asset’s scale counts, and treated as a single point on a curved space — the space of all such matrices. Three things follow that the price cannot give.
The first is a position. The Topological Survival Score says how many independent directions the panel’s risk is spread across — 100% when every direction carries equal weight, near zero when one carries almost all of it. It is the whole spectrum, not its largest term. A desk that tracks average pairwise correlation, or the share of variance in the first principal component, sees a shadow of this: one number, from one part of the table. The score uses all seventeen eigenvalues and answers a different question — not how much do these assets co-move, but how many ways out does this book still have.
The second is a speed. Because the structure sits on a curved space, the distance between today’s covariance and yesterday’s is a well-defined quantity, measured in log units of the spectrum. That matters more than it sounds: the yardstick does not shrink as the structure concentrates. A move from crowded to very crowded is counted on the same scale as a move from spread to crowded. The velocity of the Papadopoulos Distance is that quantity, one reading per close, and it is the one that turns out to carry the operational content of 2020.
The third is a clock. A price recovers when it crosses its old high. A structure recovers when its directions re-acquire histories of their own, and the two clocks run at different speeds. In 2020 they disagreed by years.
None of this is a forecast. All three are descriptions of the state of the system at the close — which is exactly what a value-at-risk number is not.
January: the tape went up. The structure went down.
The panel entered 2020 at its most diversified reading of the replay to that date. On 10 January the TSS printed 39.4%, the Papadopoulos Distance 7.58, the FCI 0.44 — against a 2019 median of 28.2% and an FCI median of 0.48. The fourth quarter of 2019 had been kind to the structure: a phase-one trade deal, three Federal Reserve cuts, an index grinding to records. Risk was spread across the panel’s directions about as evenly as it would be at any point in the three years replayed here.
Then it stopped being spread. On 27 January, the first session in which the virus moved US markets — the S&P 500 fell 1.6% on reports of the outbreak spreading beyond Hubei — the score dropped from 36.7% to 33.2% in a single session, at a velocity of 0.39, its largest displacement since August 2019. The index recovered that loss inside a week and set seven more record closes, the last on 19 February. The structure did not recover it at all. By 19 February the TSS read 30.9%: −8.4 points, or −21%, from 10 January, across twenty-six sessions in which the S&P 500 gained 3.7%.
The caveat comes before the argument. A reading of 30.9% was not, by itself, distressed — it sat above the 2019 median. What distinguishes it is the direction, and the tape that accompanied it. On prices, the six weeks to 19 February were a bull market. On the geometry of the panel’s covariance, they were a steady loss of the capacity to absorb a shock from more than one direction at once. We observe the divergence; we do not claim anyone could have read it live in 2020, because nobody was running this instrument. What the replay shows is the state the system was in when the shock arrived. The forest was dry.
Twenty sessions
What followed is the part everyone remembers, and the geometry records it with an unusual degree of structure.
Monday 24 February. Italy quarantined eleven towns over the weekend; the S&P 500 fell 3.4%. The TSS dropped from 30.6% to 25.2% in one session, at a velocity of 0.75 — almost double the 27 January displacement. Thursday 27 February. The index fell 4.4%, its largest one-day decline since 2011; the TSS reached 18.2%, the velocity 0.91, the FCI 0.70. Two sessions of price damage had taken the structure from above the 2019 median to below its tenth percentile.
Monday 9 March. Saudi Arabia and Russia opened an oil price war over the weekend; the S&P 500 fell 7.6% and the first market-wide circuit breaker since 1997 tripped four minutes after the open. This was the session the structure moved fastest: velocity 1.33, the largest single-session displacement in the six and a half years of the replay — the only other reading above 1.0 came in April 2025 — and the TSS fell from 14.4% to 10.5%. The Papadopoulos Distance, 7.58 on 10 January, passed 13. Thursday 12 March, the S&P’s −9.5% session, carried the FCI to its maximum, 0.98, from 0.44 nine weeks earlier. Monday 16 March, the −12% session, the worst since October 1987, with the VIX closing at a record 82.69, brought the TSS to 6.4%. The floor was 6.4% on Wednesday 18 March — the fourth circuit-breaker session of the fortnight — with the Papadopoulos Distance at 15.22, double its January reading.
From the record close of 19 February to 18 March: twenty sessions, and 79% of the panel’s capacity to diversify gone. From the January peak, 84%. Over the same twenty sessions the S&P 500 lost 29%; it would lose a further 7% in the three that followed. The structure was by then close to one-dimensional: a score of 6.4% on seventeen series means the spectrum had collapsed onto a single dominant direction, with the remaining sixteen carrying almost nothing of their own.
Where the index stood when the structure moved fastest
Two dates in that sequence carry the operational content of the replay. Neither is the one the drama of the price moves points to.
Take 9 March first, and take the obvious objection with it. That the structure’s peak speed came before its floor is arithmetic: speed is the rate of change of the level, and a fall decelerates before it stops. No desk needs a manifold to know that. What is not arithmetic is where the index stood when the structure made that move. On the close of 9 March the structure had completed 83% of its fall from the February record to the 18 March floor. The S&P 500 had completed 56% of its own, and was still 18.5% above its eventual closing low. The two series were falling together; they were not falling in proportion. Most of what the structure had to lose, it had lost by the first circuit breaker. Most of what the price had to lose was still ahead.
Set that against what a desk was actually holding in its hand that evening. A value-at-risk estimate — on a one-year equal-weight window, or the faster exponentially-weighted variant most risk systems run — was in the process of recalibrating to the new regime, and would continue to for weeks. But the more important difference is not speed. It is the object. VaR sizes the loss a book may take. The velocity reading sizes how far the book’s structure moved in that session — how many of its independent directions folded into one. On the close of 9 March it said that the covariance had just made the largest single-session move of the replay and was still accelerating. It said nothing about where prices would go. Whatever a committee would have done with that, it would have had it on the day.
The second date is 18 March. The structure touched its floor three sessions before the S&P 500 touched its closing low of 2,237.40 on 23 March. On 19 March the velocity turned negative — −0.36, the structure moving back toward diversification — while the index still had two down sessions in it and the Federal Reserve’s open-ended purchase programme was four days away. We observe that the geometry stopped deteriorating before prices did; we draw no rule from one episode. But the sign of the velocity changed on 19 March, and the sign of a velocity is a quantity a risk desk reads at the close, not in hindsight.
One hundred and seventeen sessions
The fall is the half of the story the tape tells well. The rebuild is the half it conceals.
The S&P 500 closed at a new record on 18 August 2020, 103 sessions after its low, and the consensus of that summer was that the crash had been erased. On the same day the panel’s TSS read 22.0% — a little over half of its 10 January level. The structure crossed the halfway mark, 22.9%, on 2 September, 117 sessions after its floor. It did not regain the 19 February reading of 30.9% until 18 September, 128 sessions out. Its best reading of 2021 was 36.9%, on 23 February 2021. The January 2020 level of 39.4% does not reappear in the replay until May 2024.
Twenty sessions down; 117 to halfway back. The asymmetry is a factor of nearly six, and it is the number in this piece that generalises least comfortably and matters most. Diversification capacity, on this evidence, is destroyed at one speed and rebuilt at another. A book that was “back to even” on 18 August 2020 by the measure of its index was, by the measure of how many independent directions its risk could still escape into, carrying about half the structural protection it had carried in January. The index recovered. The oxygen did not — not for another four years, on this panel.
There is a mechanical reason, and it is not exotic. A covariance structure concentrates in a single session because one factor — liquidity, in March 2020 — takes over every asset at once. It de-concentrates only as the individual assets re-acquire histories of their own, and a 60-session window cannot forget a shock faster than sixty sessions allow. But 117 sessions is roughly twice the window. The slowness is not a property of the window. It is a property of the market.
Exogenous trigger, endogenous transmission
The objection to any replay of 2020 is obvious and correct: the virus was not in any dataset. No covariance structure, on any panel, at any window, carried information about a zoonotic event in Wuhan. Say it plainly, because the argument does not need to pretend otherwise. The trigger was exogenous, and the instrument described here had nothing to say about it — and would have had nothing to say had it existed.
What it measures is the other half of a crisis: the state of the system the trigger lands on. Lightning is not forecastable. The dryness of the forest is measurable, every day, and it is the dryness — not the lightning — that decides whether a strike becomes a fire. The replay speaks to that half, and only that half: a structure a fifth thinner before the shock; a speed reading that peaked with the index still 18.5% above its low; a recovery clock that ran four years behind the price.
One replay is one episode. The Dot-com and 2007 panels sit in the same engine and are not cited here, because the point of this piece is not that the pattern is universal. It is that the pattern was present, measurably, in the one episode everyone agrees was unforeseeable — which is the hardest case for the claim that transmission is endogenous, and the one where it is easiest to check.
What one episode is worth to a risk committee
What follows is what this single retrospective episode shows about where structural exposure can sit — read through experimental metrics, on a panel chosen after the fact. It is an observation, not a recommendation, and one episode is not evidence of a rule; none of it argues for adopting these measures. It names no instrument, size or timing.
- Index level and diversification capacity can move apart. In 2020, on this panel, they disagreed for six weeks on the way in and four years on the way out. A book read through the index alone would have looked healthy on 19 February and healed on 18 August; on the structural reading it was neither. Whether that gap recurs is exactly what a pre-registered live record — not a replay — would have to establish.
- A structure’s motion is a close-of-day quantity, and a different object from VaR. The largest single-session move of this episode came with the structure 83% of the way to its floor and the index 56% of the way to its own. VaR sizes the loss; this reading counts how many independent directions folded into one. That is a distinction of what is measured, not a claim that one predicts prices.
- Recovery of diversification ran slower than its destruction — here, by nearly six times. On this single episode, a framework that re-admits full diversification benefit as soon as the index recovers would have done so about a year early. We report the asymmetry; we do not generalise it from one crisis.
Run the same geometry on your own exposure — book a 30-minute discovery session →
Method and data
Panel. “Forensic — COVID-19 2020”, seventeen assets: SP500, NASDAQ; XLK, XLF, XLY, XLP, XLI, XLV, XLE, XLU, XLB; GLD, TLT, VIX; US 10-year yield (FRED DGS10), US high-yield OAS (FRED BAMLH0A0HYM2), EUR/USD. Prices from Yahoo Finance and FRED. Series extracted from 2 January 2019; first reading 29 March 2019; replay runs to the present. Inputs. Log-returns for the price series; first differences for the yield and the spread. Window 60 sessions. Manifold SPD(17): at each date the 60-session correlation matrix of the seventeen series, read whole — all seventeen eigenvalues. Dp = ‖ln λ‖₂; velocity = ΔDp per session. Engine: the current production engine, the same one that produces the live weekly panels. Readings are computed at each date from data up to that date only; the panel composition is the only element chosen with hindsight. Derived ratios in the text (83% / 56% of the fall completed on 9 March) are computed from the readings and closes in the table below. Not shown: zone labels (the panel’s theoretical TSS ceiling makes them uninformative here), Two-Prices deviations, contagion epicenters. Not comparable: TSS levels on this panel against any live weekly panel.
| Date | Event | TSS (%) | Dp | Velocity | FCI |
|---|---|---|---|---|---|
| 10 Jan 2020 | Pre-crisis peak of the structure | 39.37 | 7.58 | −0.11 | 0.44 |
| 27 Jan 2020 | First virus session, S&P −1.6% | 33.18 | 8.14 | 0.39 | 0.50 |
| 19 Feb 2020 | S&P 500 record close, 3,386.15 | 30.93 | 8.58 | −0.04 | 0.43 |
| 24 Feb 2020 | Italy lockdowns, S&P −3.4% | 25.21 | 9.43 | 0.75 | 0.62 |
| 27 Feb 2020 | S&P −4.4% | 18.16 | 10.74 | 0.91 | 0.70 |
| 9 Mar 2020 | Oil price war, first circuit breaker, S&P −7.6% (close 2,746.56) | 10.49 | 13.01 | 1.33 | 0.92 |
| 12 Mar 2020 | S&P −9.5% | 7.88 | 14.27 | 0.82 | 0.98 |
| 16 Mar 2020 | S&P −12.0%, VIX close 82.69 | 6.44 | 15.06 | 0.47 | 0.89 |
| 18 Mar 2020 | Floor of the structure, S&P 2,398.10 | 6.38 | 15.22 | 0.11 | 0.85 |
| 23 Mar 2020 | S&P 500 closing low, 2,237.40 | 7.68 | 14.63 | −0.13 | 0.83 |
| 18 Aug 2020 | S&P 500 back at a record, 3,389.78 | 22.01 | — | — | — |
| 2 Sep 2020 | Half-way rebuilt (117 sessions) | 22.94 | 9.78 | — | — |
| 18 Sep 2020 | 19 February level regained (128 sessions) | 30.98 | 8.86 | — | — |
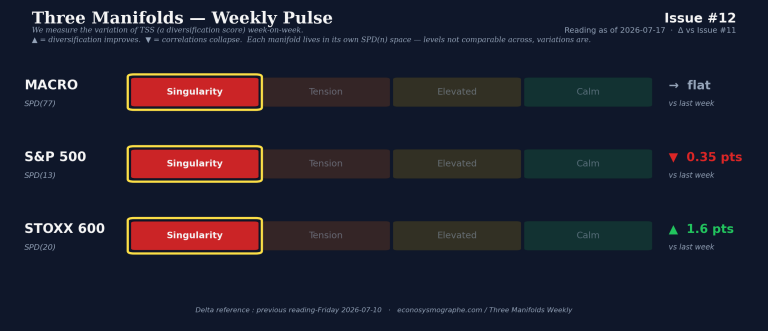
The weekly readings of the three live panels are suspended this issue; they resume on 30 August on a re-based daily macro panel.
See the reading on your own portfolio
This is Issue #17 of Three Manifolds — Weekly Market Reading, a forensic replay.
- Discovery session — 30 minutes on current market data, no portfolio upload → econosysmographe.com/book-a-discovery-session
- The platform — the console the live readings come off, on D-1 data → econosysmographe.com/platform
- Evidence — how we define proof, and its limits → econosysmographe.com/evidence
- Research & SSRN working papers → econosysmographe.com/researchs
- Direct correspondence → contact@econosysmographe.eu
Sources
- S&P 500 closing levels, 2020: record close 3,386.15 on 19 February; 2,746.56 on 9 March (−7.6%); 2,480.64 on 12 March (−9.5%); 2,386.13 on 16 March (−12.0%); 2,398.10 on 18 March; closing low 2,237.40 on 23 March; 3,389.78 on 18 August — Yahoo Finance historical data; S&P 500 closing milestones
- Market-wide circuit breakers triggered on 9, 12, 16 and 18 March 2020; first since 27 October 1997 — Berkeley Law, March 2020 review; CNBC, 16 March 2021
- CBOE VIX record close 82.69 on 16 March 2020 — Yahoo Finance historical data
- Federal Reserve: target range cut to 0–0.25% on 15 March 2020; open-ended Treasury and MBS purchases announced 23 March 2020 — Federal Reserve press releases
- Econosysmographe™ Forensic COVID panel, production payload of 19 August 2026 — Trident-AI Engine v3.0, Papadopoulos Distance, SPD(17), 60-session correlation
Disclosure of interest: the author developed the Universe Risk Framework and the Econosysmographe™ platform referenced here, and this article discusses his own research metrics and tools — which are experimental and not established market standards. It is first-party research published on the author’s own platform, not independent third-party analysis.
SmartGreenInvest Ltd holds no positions in the issuers named in this analysis. The author is a self-directed retail investor with personal exposure to US technology equities and other asset classes, at a scale immaterial to the market capitalisations discussed.
This article is a retrospective replay, computed by the current production engine on a panel chosen after the fact. The instrument did not exist in 2020, and no reading of this episode was issued at the time. Nothing in it is a forecast, and nothing in it should be read as evidence that the episode could have been anticipated.
Educational purpose only. Not financial advice. SmartGreenInvest Ltd (Reg. England & Wales No. 14636473) is not an FCA-authorised firm.
By Evangelos Papadopoulos · Independent Researcher · econosysmographe.com