Hypercorrelation. And the Fed Is the Epicenter.
Five hedges, one exit — and the 3-month T-Bill (TBIL ETF) is the most geometrically divergent component on a 77-asset panel: +142.9% above its panel-derived equilibrium return path, an annualised ~2.5 percentage-point gap on the Fed Funds equivalent. The asset most controlled by the Fed is the one most disconnected from the rest of the system.
Three Manifolds · Weekly Market Reading · Issue #6 · Sunday 7 June 2026 · Reading as of Friday 5 June 2026 close · 7 min read
Key takeaways · 30-second read
- MACRO Epicenter is PC72 TLT (Long Treasury bond) — emission, SHORT — with US 2Y Yield in its top-3 cluster. The panel’s widest gap is the 3-month T-Bill (TBIL ETF) at +142.9% above its panel-derived equilibrium return path. Annualised: the geometric equilibrium implies a Fed Funds equivalent of ~2.00% vs ~4.50% actual — a 2.5pp geometric gap on the policy rate.
- US S&P 500 velocity flipped to slow_escape (+0.088, delta +0.107) — TSS holds Tension at 51.14%, 11/11 sectors still in Rupture, epicenter is XLC Comm Services (systemic_norm 0.32) — and its top-3 cluster pulls XLK Technology and XLRE Real Estate with it.
- DACH STOXX 600 explicit epicenter is PC18 Construction (systemic_norm 0.373, the highest emission norm in the panel) — sitting in the Periphery but emitting through Health + Food & Beverage. Utilities widest at +52.04% σ. Macro context: Eurozone Construction PMI 41.7, Germany housing −18% YoY.
- FOR AN ALLOCATOR Gold $4 365 vs geodesic $5 406 — now −23.5% UNDER (Issue #4 deep-read validated). Brent at $93.09 vs $109.42 P_eq — Ricci Gap +17.6%. Three consecutive sub-manifold calls confirmed. Macro velocity now reads fast_escape.
See how the manifold reads your portfolio →
Hypercorrelation — when the diversification disappears
Hypercorrelation.
The S&P 500 had its worst day since October. Gold dropped to its 2026 low. Bitcoin lost 14% in seven days. The long-Treasury bond sold off. The dollar pushed back toward 100. Five asset classes that institutional risk frameworks treat as decorrelating hedges moved in the same direction this week — into a single exit door. That is the textbook signature of hypercorrelation: asset-class correlations converging toward +1 (the upper bound of the Pearson coefficient — perfect positive co-movement), and the entire diversified hedge architecture collapsing simultaneously. It is the scenario every Chief Investment Officer fears most — and the scenario that VaR, CVaR, and scenario-stress frameworks, by construction, cannot see coming.
The trigger was Friday’s non-farm payrolls : +172 000 jobs against a consensus of 80–85 000, unemployment at 4.3%, the 10-year yield closing at 4.534%, and the CME FedWatch tool pricing a 70% probability of a Federal Reserve rate hike by year-end. The VIX jumped +39.7% to 21.51. The economy is too strong; the inflation case is reasserting itself; the rates cluster is taking the systemic load. And the manifold’s reading is unambiguous: the contagion epicenter is now TLT — the long-Treasury bond — emitting through US 2-year yield and US industrial production. But the single most striking finding lives in the front-end: the 3-month T-Bill (proxied by the TBIL ETF) has returned +1.55% year-to-date against a panel-derived equilibrium return of +0.64% — a +142.9% divergence. Annualised, the manifold places the geometric-equilibrium policy rate at roughly 2.00% vs the ~4.50% Fed Funds equivalent today — a 2.5 percentage-point gap between actual policy and the cross-asset equilibrium. The Fed’s own policy-rate proxy is the manifold’s widest mean-reversion candidate. The only haven the market is chasing is dollar liquidity itself.
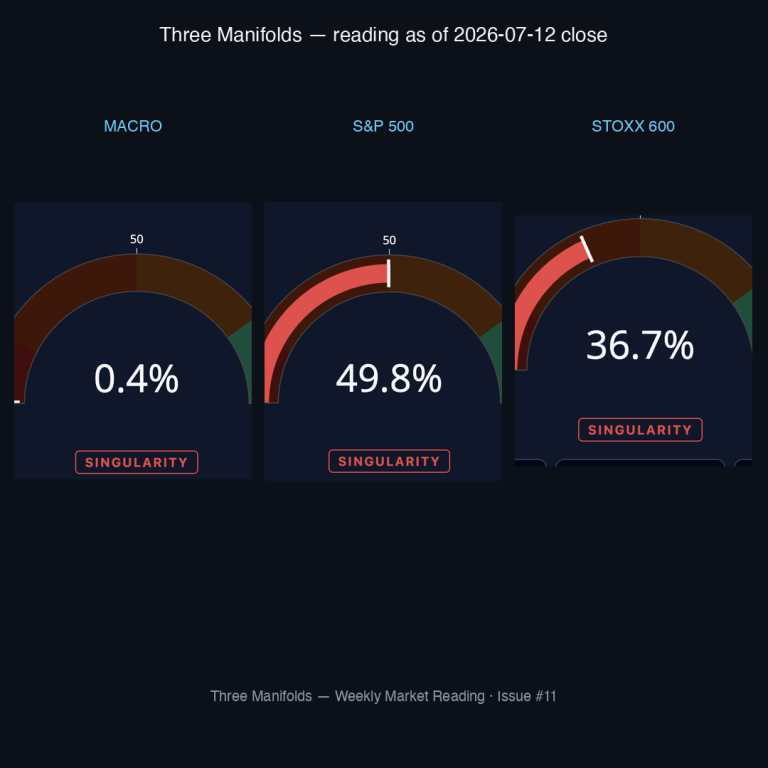
MACRO 77 nodes · 7 families
Why it matters → the systemic emitter is now the long-Treasury bond itself, and the panel’s most divergent node is the 3-month T-Bill. A book hedged for “rates risk” with long duration is carrying the emitter — not the hedge.
- TSS 1.23% — Singularity regime (deepening, well inside the alert band)
- FCI 0.8729 — High Stress (~93% of the post-COVID peak)
- Velocity +0.329 — fast_escape (the manifold is accelerating away from its singularity — note: this is the geometric-structure dynamic of the panel, not the price velocity of any single asset)
- Two-Prices : 70 of 77 nodes in Rupture (90.9%) · 7 Suture · 0 Compression
- Widest gap : US 3-Month T-Bill (TBIL ETF) — YTD return +1.55% vs panel-derived equilibrium return +0.64% · +142.9% above equilibrium · annualised gap ≈ 2.5pp on the Fed Funds equivalent
- Epicenter (PC72, EMISSION, SHORT) : TLT — top-3 cluster: TLT + US 2Y Yield + IP USA
- CORE emitters (6 nodes) : MSCI Financials, Credit_Spread_BB (systemic_norm 0.166), MSCI Industrials, TIP, MSCI Europe Eurozone, TLT
The macro reading is internally consistent. TLT explicitly emits, with US 2-year yield and US industrial production in its top-3 cluster. The Core ring carries six emission nodes — including BB credit spreads (the highest norm in the Core), TIPS, MSCI Financials, MSCI Industrials, MSCI Europe Eurozone. The rates-and-credit complex is the systemic emitter this week, not the absorber. And one layer beneath the network sits the finding that matters most: the TBIL ETF (cleanest market exposure to 3-month Treasury bills) has returned +1.55% year-to-date against a panel-derived equilibrium return path of +0.64% — a +142.9% divergence on the manifold’s internal return geometry. Annualised, that translates to a Fed Funds equivalent of ~4.50% (actual) vs ~2.00% (geometric equilibrium) — a 2.5 percentage-point gap on the Fed’s own short rate.
A word on what makes this finding institutionally singular. The 3-month T-Bill is not “market-driven” in the conventional sense — its level is anchored, almost mechanically, by the Federal Reserve’s policy rate. That the manifold flags it as the most geometrically divergent component on a 77-asset panel of equities, FX, commodities, credit, and international macro instruments means precisely this: the cross-asset covariance structure of the rest of the system considers current policy significantly disconnected from everything else. The single asset that should mechanically follow the policy lever is the one most out of equilibrium with the panel’s internal geometry. The geometry describes this divergence; it does not prescribe its resolution.
Velocity completes the picture: at +0.329 fast_escape, the panel is accelerating away from its singularity — not drifting, accelerating.
See this rates-credit reading on your multi-asset book →
US S&P 500 · 11 sectors
Why it matters → the S&P velocity flipped from slow_reversion to slow_escape this week — the first directional turn in five weeks of Rupture — and the contagion epicenter is XLC Comm Services with **XLK Technology and XLRE Real Estate inside its top-3 cluster**. The geometry says the megacap tech complex is not three independent positions; it is *one* contagion cluster.
- TSS 51.14% — Tension zone (regime classifier still Singularity)
- FCI 0.4208 — Calm (tightening, delta +0.061)
- Velocity +0.088 — slow_escape (delta +0.107 vs previous, directional flip)
- Entropy 2.6774 · DP Global 4.51
- 11 of 11 sectors in Rupture (100% — sixth consecutive week)
- Widest gap : Comm Services (XLC) at +38.31% σ — spot ~46.68% above its geodesic
- Epicenter (PC9, INDUCED zone, EMISSION, SHORT) : XLC Comm Services · systemic_norm 0.322 (highest in panel) · top-3 cluster : XLC + XLK + XLRE
- CORE nodes (emission) : PC8 XLU Utilities (top-3 cluster: XLE + XLU + XLRE) · PC10 XLE Energy (top-3: XLE + XLF + XLY)
- INDUCED nodes : XLP Consumer Staples · XLC Comm Services (epicenter) · XLY Consumer Discretionary · XLK Technology · XLRE Real Estate
| Sector | ETF | Deviation σ above geodesic |
|---|---|---|
| Communication Services | XLC | +38.3% |
| Real Estate | XLRE | +33.7% |
| Utilities | XLU | +32.1% |
| Consumer Discretionary | XLY | +32.1% |
| Energy | XLE | +28.3% |
| Materials | XLB | +23.5% |
| Industrials | XLI | +22.7% |
| Financials | XLF | +21.7% |
| Health Care | XLV | +18.6% |
| Consumer Staples | XLP | +15.9% |
| Technology | XLK | +15.4% |
Three findings worth carrying. One — the velocity flipped. The S&P manifold printed +0.088 slow_escape this week — the first positive turn since the panel entered Rupture. Two — XLC is the epicenter, and it pulls Technology with it. Communication Services (mega-cap media: GOOGL, META, NFLX) sits at the highest systemic emission norm in the entire S&P panel (0.322, more than triple the next-highest sector). Critically, XLC’s top-3 contagion cluster is XLC + XLK + XLRE — Communication Services + Technology (chip-and-hardware: NVDA, AVGO, AMD) + Real Estate, all geometrically connected through the PCA emission cluster. On simple sigma alone, XLK is the least stretched sector (+15.4%); on cluster geometry, XLK is inside the emission cluster. The “Tech is safe because Tech σ is low” reading does not survive. Three — XLC remains widest at +38.31% σ (spot 46.68% above its geodesic). 11/11 still in Rupture, but the directional pressure is moving — through duration-sensitive sectors first.
Run the S&P sector reading on your exposure →
DACH STOXX 600 · 20 sectors
Why it matters → the European explicit epicenter is Construction — emitting from the Periphery with the highest emission norm in the entire panel — and the Core ring is a defensive-and-input complex (Basic Resources + Health + Telecom). The European geometry is a textbook housing-and-supply-side reading.
- TSS 26.97% — Singularity regime
- FCI 0.3775 — Calm
- Velocity +0.045 — slow_escape (delta +0.078 vs previous, directional flip mirroring the S&P)
- Entropy 2.5320 · DP Global 9.26
- 19 of 20 sectors in Rupture · 1 in Suture (Travel & Leisure, the unchanged hold-out)
- Widest gap : Utilities at +52.04% σ — spot 68.27% above its geodesic (closing the gap would imply a ~−40.6% structural correction)
- Epicenter (PC18, PERIPHERY zone, EMISSION, SHORT) : STOXX600 Construction · systemic_norm 0.373 (highest in panel) · top-3 cluster : Construct + Health + Food_Bev
- CORE nodes : PC16 Basic Resources (absorption · top-3: Basic_Res + Retail + Broad) · PC19 Health Care (emission · top-3: Health + Food_Bev + Retail) · PC20 Telecommunications (absorption · top-3: Telecom + Autos + Insurance)
- INDUCED : PC8 Real Estate (emission, systemic_norm 0.454) · plus 6 other sector PCs
| Sector | Deviation σ | Regime |
|---|---|---|
| Utilities | +52.0% | Rupture |
| Insurance | +41.1% | Rupture |
| Personal & Household Goods | +41.1% | Rupture |
| Real Estate | +35.8% | Rupture |
| Construction | +33.8% | Rupture |
| Automobiles | +32.0% | Rupture |
| Food & Beverage | +30.5% | Rupture |
| Media | +29.7% | Rupture |
| Oil & Gas | +27.8% | Rupture |
| Banks | +27.5% | Rupture |
| Financial Services | +27.5% | Rupture |
| Telecommunications | +25.4% | Rupture |
| Basic Resources | +25.3% | Rupture |
| Chemicals | +24.6% | Rupture |
| Health Care | +24.7% | Rupture |
| Retail | +24.6% | Rupture |
| Industrials | +23.8% | Rupture |
| Broad Market | +21.6% | Rupture |
| Technology | +21.3% | Rupture |
| Travel & Leisure | +13.7% | Suture |
The European panel carries two distinct readings. The widest static gap is Utilities at +52% σ — the largest deviation from any sector’s own geodesic equilibrium. But the explicit contagion epicenter is PC18 Construction — the highest systemic emission norm in the panel, at 0.373. Two different questions: where the largest position lives, vs which sector emits the most stress through the PCA cluster. And the answer to the second question — Construction — is the one that matters geometrically.
Construction sits in the Periphery zone of the contagion network, not the Core, yet carries the strongest emission norm of the panel. A peripheral node with the highest emission is the geometric signature of a localized but high-intensity stress, propagating into the Core via Construction’s top-3 cluster (Construction + Health Care + Food & Beverage). The Core itself contains Basic Resources (absorption — the input layer to construction), Health Care (emission), and Telecommunications (absorption). Real Estate sits in Induced with the second-highest emission norm in the panel (0.454).
The macro context closes the loop. The HCOB Eurozone Construction PMI printed 41.7 in April 2026 — its sharpest contraction since August 2024, on a four-year monthly decline streak. Germany’s apartment completions fell to their lowest count since 2012 (−18% year-on-year). France led the construction decline; Germany followed. The manifold’s identification of Construction as panel epicenter is exactly what a financial geometry would flag for a structural European housing-supply contraction in real time — and the macro data confirms it the same month.
See the European housing-credit manifold on your book →
Tech is no longer decoupled — and the real-economy fragility just got macro validation
In our 29 April 2026 letter on European alternatives we flagged two parallel configurations : (1) XLK Technology, XLF Finance, and XLY Consumer Discretionary sat in the periphery of the S&P contagion network — decoupled from the stress, allowing the index to climb while the manifold read Tension; (2) the Euro Stoxx 600’s stress was concentrated in construction and cyclical industrials — the European real-economy fragility. Six weeks later, both configurations have rotated — and both have been validated.
On the S&P side, XLK is no longer in the periphery. The epicenter PC9 XLC Communication Services has the highest systemic norm in the panel (0.322), and its top-3 contagion cluster is XLC + XLK + XLRE. The “tech is insulated” thesis from April is closing in real time. On the European side, the explicit epicenter is PC18 Construction (norm 0.373, the highest in the panel) — and the Eurozone Construction PMI printed 41.7 in April 2026, its sharpest contraction since August 2024, with Germany apartment completions at their lowest since 2012 (−18% YoY). The geometry timestamped the trajectory six weeks ago; the macro reality has now caught up.
Underneath both rotations sits one mathematical anchor. The 3-month T-Bill is among the least volatile series in the macro panel. By every metric a traditional risk framework computes — VaR, CVaR, expected shortfall, the Population Stability Index, scenario stress tests — it is the series that reads “no signal”. Yet the manifold’s Two-Prices reading places its YTD return at +1.55% vs a panel-derived equilibrium of +0.64% — a +142.9% divergence, translating to a ~2.5 percentage-point gap between the actual Fed Funds equivalent (~4.50%) and the geometric equilibrium (~2.00%). The least-volatile series is the most divergent — exactly the configuration we built the Universe Risk Framework to detect: the disappearance of structure in a node that marginal-distribution metrics declare benign. We called this category of signal geometric zombification in our 29 April letter (European mid-caps kept alive by accommodative credit, geometrically stretched, geometrically invisible to standard monitoring); six weeks later, the same epistemic edge is pointing at a different node — the policy-rate proxy itself.
That is the dilemma in geometric form. The over-capitalized cluster — XLC mega-cap media (GOOGL, META, NFLX), XLK Technology (NVDA, AVGO, AMD), XLRE Real Estate — sits widely above its geodesic equilibria, emitting through Communication Services. The employment-heavy cluster — European Construction at its weakest PMI in two years, Banks Europe under refinancing-cycle pressure, US Real Estate and Industrials in Rupture, the mid-cap segment we mapped in April as geometric zombification — absorbs the rates-cluster emission.
The manifold describes the configuration. It does not resolve it.
What can the Fed do? What will the Fed do? And what would you do, sitting in the Chair’s seat?
The over-capitalized cluster needs the Fed to keep rates where they are — long discount rates that punish duration-sensitive megacaps would break the XLC + XLK + XLRE complex. The employment-heavy cluster needs the Fed to cut — Construction Europe at its weakest PMI in two years, US mid-cap refinancing wall, Banks Europe under margin pressure. The two clusters are pulling in opposite directions, and the Fed’s chair has to choose. The manifold tells you where the geometric load sits this week. It does not tell you what the right answer is. What’s yours?
Cross-layer takeaway — three sub-manifold calls confirmed
Three manifolds, three different stories, one common engine this week: dollar-liquidity preference. The 10-year at 4.55%, the dollar index near 100, Fed Funds futures pricing 70% probability of a hike — that is the gravitational field every other asset is pulling against. Gold. Spot $4 365 vs geodesic $5 406 — log-divergence −23.5% UNDER; the Issue #4 deep-read at +75% σ overbought has been validated with extraordinary force as gold posted its worst weekly close of 2026. Brent. Spot $93.09 vs P_eq $109.42 — Ricci Gap +17.6% undervalued (Issue #5 read: +15.9%); Brent rose +2.2% this week against US-Iran Strait-of-Hormuz tensions, the directional call validated by spot. 3-month T-Bill (TBIL ETF). The new anchor: YTD return +1.55% vs panel-derived equilibrium +0.64% — a +142.9% divergence. Annualised, the manifold places the geometric-equilibrium Fed Funds equivalent at ~2.00% against the ~4.50% actual — a 2.5 percentage-point gap on the Fed’s own short rate. The cleanest empirical proxy for the policy rate, the widest individual gap on the 77-asset panel. Two consecutive sub-manifold calls validated (Gold, Brent), and the third this week is the manifold pointing — descriptively, not prescriptively — at the policy rate itself. Caveat: macro velocity has flipped to fast_escape at +0.329, and the post-COVID sample of comparable accelerations is thin. We attach no probability and no timing.
FOR AN ALLOCATOR What this means for your book
Why it matters → the geometry reads one engine driving four parallel sell-offs (equities, gold, bonds, crypto) — dollar-liquidity preference. The hedge architecture built for asset-class diversification is hedging *correlated* assets.
Four questions for a book. One — the rates cluster is the systemic emitter, not the absorber. TLT explicitly emits, BB credit spreads sit in the Core: a book carrying duration as a hedge is carrying the emitter. Two — the European Core is a property-and-credit complex, not a generic defensive rotation. Construction as the explicit epicenter, Utilities widest at +52% σ, an empirical Construction PMI at its sharpest contraction since 2024. A European book hedged for “defensive rotation” is hedging Health Care; the geometry says the axis is real estate and bank credit. Three — the sub-manifold pattern is now three-for-three. Gold deep-read (Issue #4) validated by a −23.5% log-divergence flip; Brent Ricci Gap (Issue #5) validated by a +2.2% spot move; the S&P widest-gap (XLC) closing via spot correction this week. Two confirmations in three weeks is a tiny sample — we report it as such. Four — dollar liquidity is the engine, not “safe haven” rotation. When gold, bonds, equities, and crypto all sell off into the dollar, the market is not de-risking into safety — it is repricing the risk-free rate itself. The hedge that works in that environment is dollar duration shortened, not lengthened.
See how the manifold reads your portfolio →
Tactical horizon
We observe a configuration, not a forecast. What changed this week: the macro epicenter is now TLT in the long-bond cluster (with BB credit spreads carrying the highest Core norm), and both equity-panel velocities flipped directionally (S&P −0.06 → +0.09, STOXX −0.06 → +0.05). What did not change: macro FCI at ~93% of its post-COVID peak, the rates cluster sitting inside the Core, every panel ≥95% Ruptured, dispersion still compressed. Three observations to carry into Issue #7: whether the rates-cluster epicenter persists or rotates back to FX, whether the S&P TSS holds Tension or crosses back below 50% into Singularity, and whether Brent closes its Ricci Gap (+17.6% this week, widened from +15.9%). Gold has now reversed to the undervalued side at −23.5%; the symmetric question for Issue #7 is whether it mean-reverts back toward its geodesic from below.
See the reading on your own portfolio
This is Issue #6 of Three Manifolds — Weekly Market Reading. New reading every Sunday until early November 2026.
- Book a Geometric Discovery Session — see how the manifold reads your portfolio → econosysmographe.com/curvature-audit-engagement
- Methodology + 4 SSRN papers → econosysmographe.com/methodology
- Direct contact → contact@econosysmographe.eu
Sources — NFP and rate-hike pricing: “10-year Treasury yield surges above 4.53% as hot jobs report dents hopes for rate cuts”, CNBC, 5 Jun 2026; CME FedWatch Tool, 5 Jun 2026. · S&P sell-off: “Nasdaq, S&P 500 suffer worst day of year as AI stocks tumble and Fed rate-hike odds rise”, CNN Business, 5 Jun 2026. · Gold weekly fall: “Gold At Weakest Level in 2026; Logs Worst Weekly Fall…”, Firstpost, June 2026. · Bitcoin sell-off: “Bitcoin selloff continues as prices slide below $63,000 for the first time since February”, CoinDesk, 4 Jun 2026. · Eurozone Construction PMI: “HCOB Eurozone Construction PMI® — April 2026”, S&P Global, May 2026. · Germany housing: “Germany’s housing crisis deepens as new apartment completions fall to a decade low”, Brussels Signal, 27 May 2026. · Brent live: ICE Brent BZ=F (Yahoo Finance), 5 Jun 2026 close. · Gold live: GC=F (Yahoo Finance), 5 Jun 2026 close.
Educational purpose only. Not financial advice. SmartGreenInvest Ltd (Reg. England & Wales No. 14636473) is not an FCA-authorised firm.
By Evangelos Papadopoulos · Independent Researcher · econosysmographe.com