
A Sysmograph reading of four manifolds reveals the asymmetric fragility of 2026 — and the address of the next institutional crisis.
1. The Silence of the Numbers
For most of 2026, the dominant market narrative has been simple. The S&P 500 grinds higher, led by technology and financials. The Euro Stoxx 600 looks “morose” — flat, uninspiring, but functional. Macroeconomic indicators flash mixed signals — inflation moderating, central banks neutral, growth fragile but not breaking.
Look at any traditional dashboard and you see roughly the same story. A market under tension, but holding.
Our Sysmograph reading tells a different story. Across four parallel universes — Macro 77D, S&P 500 11 Sectors, Euro Stoxx 600, and Euro Alt 100 — the geometry of risk diverges sharply. One of these universes has been in geometric singularity for fourteen months, and nobody has noticed because the price quotes still tick.
This is not a story about a crash. It is a story about an atrophy — the slow zombification of a segment of the European economy whose structural collapse cannot be read from any single index, but whose signature is unmistakable on the manifold.
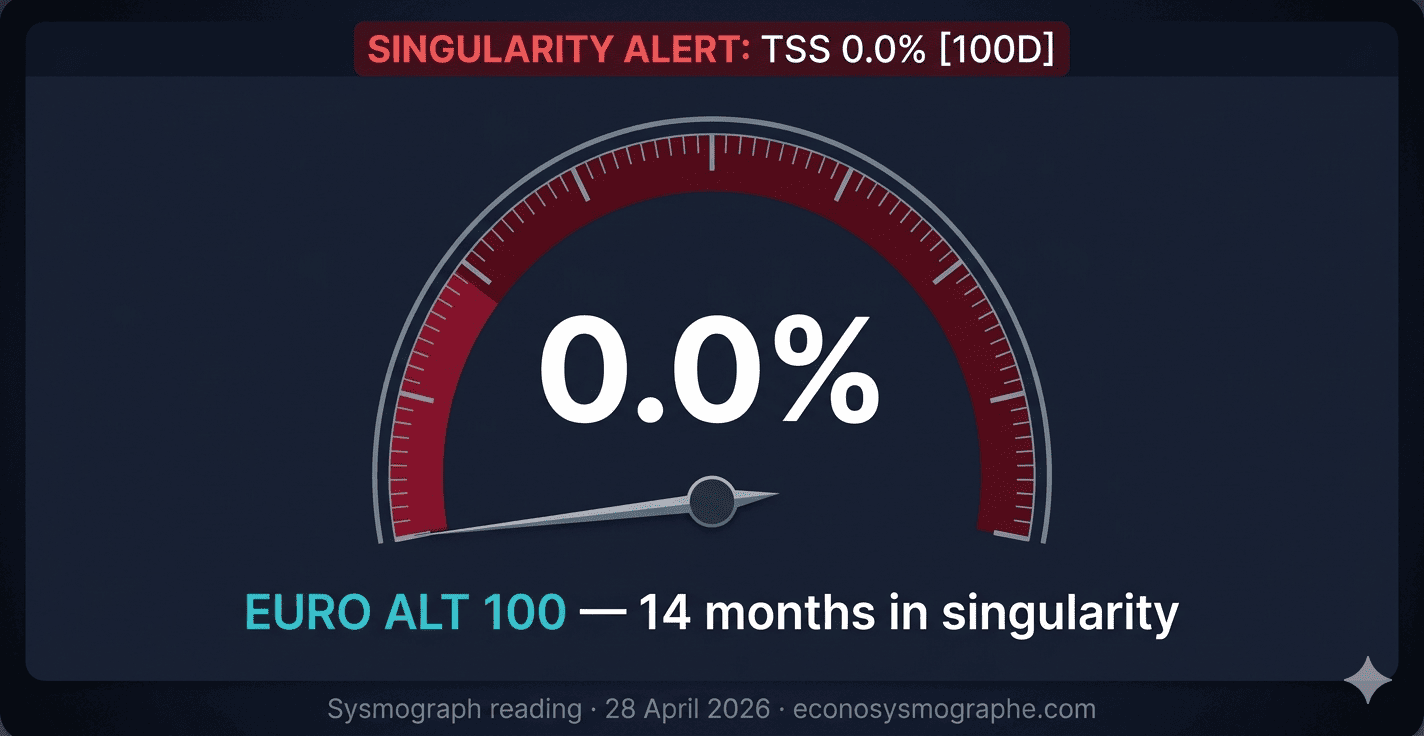
The data: TSS at 0.0%, manifold velocity still negative, no recovery since February 2025. Fourteen months.
This article reads four Sysmographs side-by-side and asks one question: what does the geometry see that the indices do not?
2. Four Manifolds, Four Regimes
A Sysmograph reading is not a single number. It is the topology of a manifold — the shape of the relationship between assets — measured continuously through Riemannian geometry on the SPD(n) manifold of rolling covariance matrices. Each universe lives on its own manifold, with its own dimension, its own assets, and its own regime.
Here are the four readings as of 28 April 2026.
| Universe | Engine | TSS | Regime | FCI | Velocity | DP Current | FCI Peak (date) | Epicentre |
|---|---|---|---|---|---|---|---|---|
| Macro Global | 77D | 9.3% | Singularity | 0.35 | +0.04 | 36.58 | 0.92 (2020-07) | TLT, GBPJPY |
| S&P 500 Sectors | 13D | 54.2% | Tension | 0.38 | +0.03 | 4.27 | 0.95 (2020-03) | XLE, USO, GLD |
| Euro Stoxx 600 | 20D | 27.9% | Singularity | 0.37 | −0.02 | 9.16 | 0.79 (2022-03) | FCC, Construction |
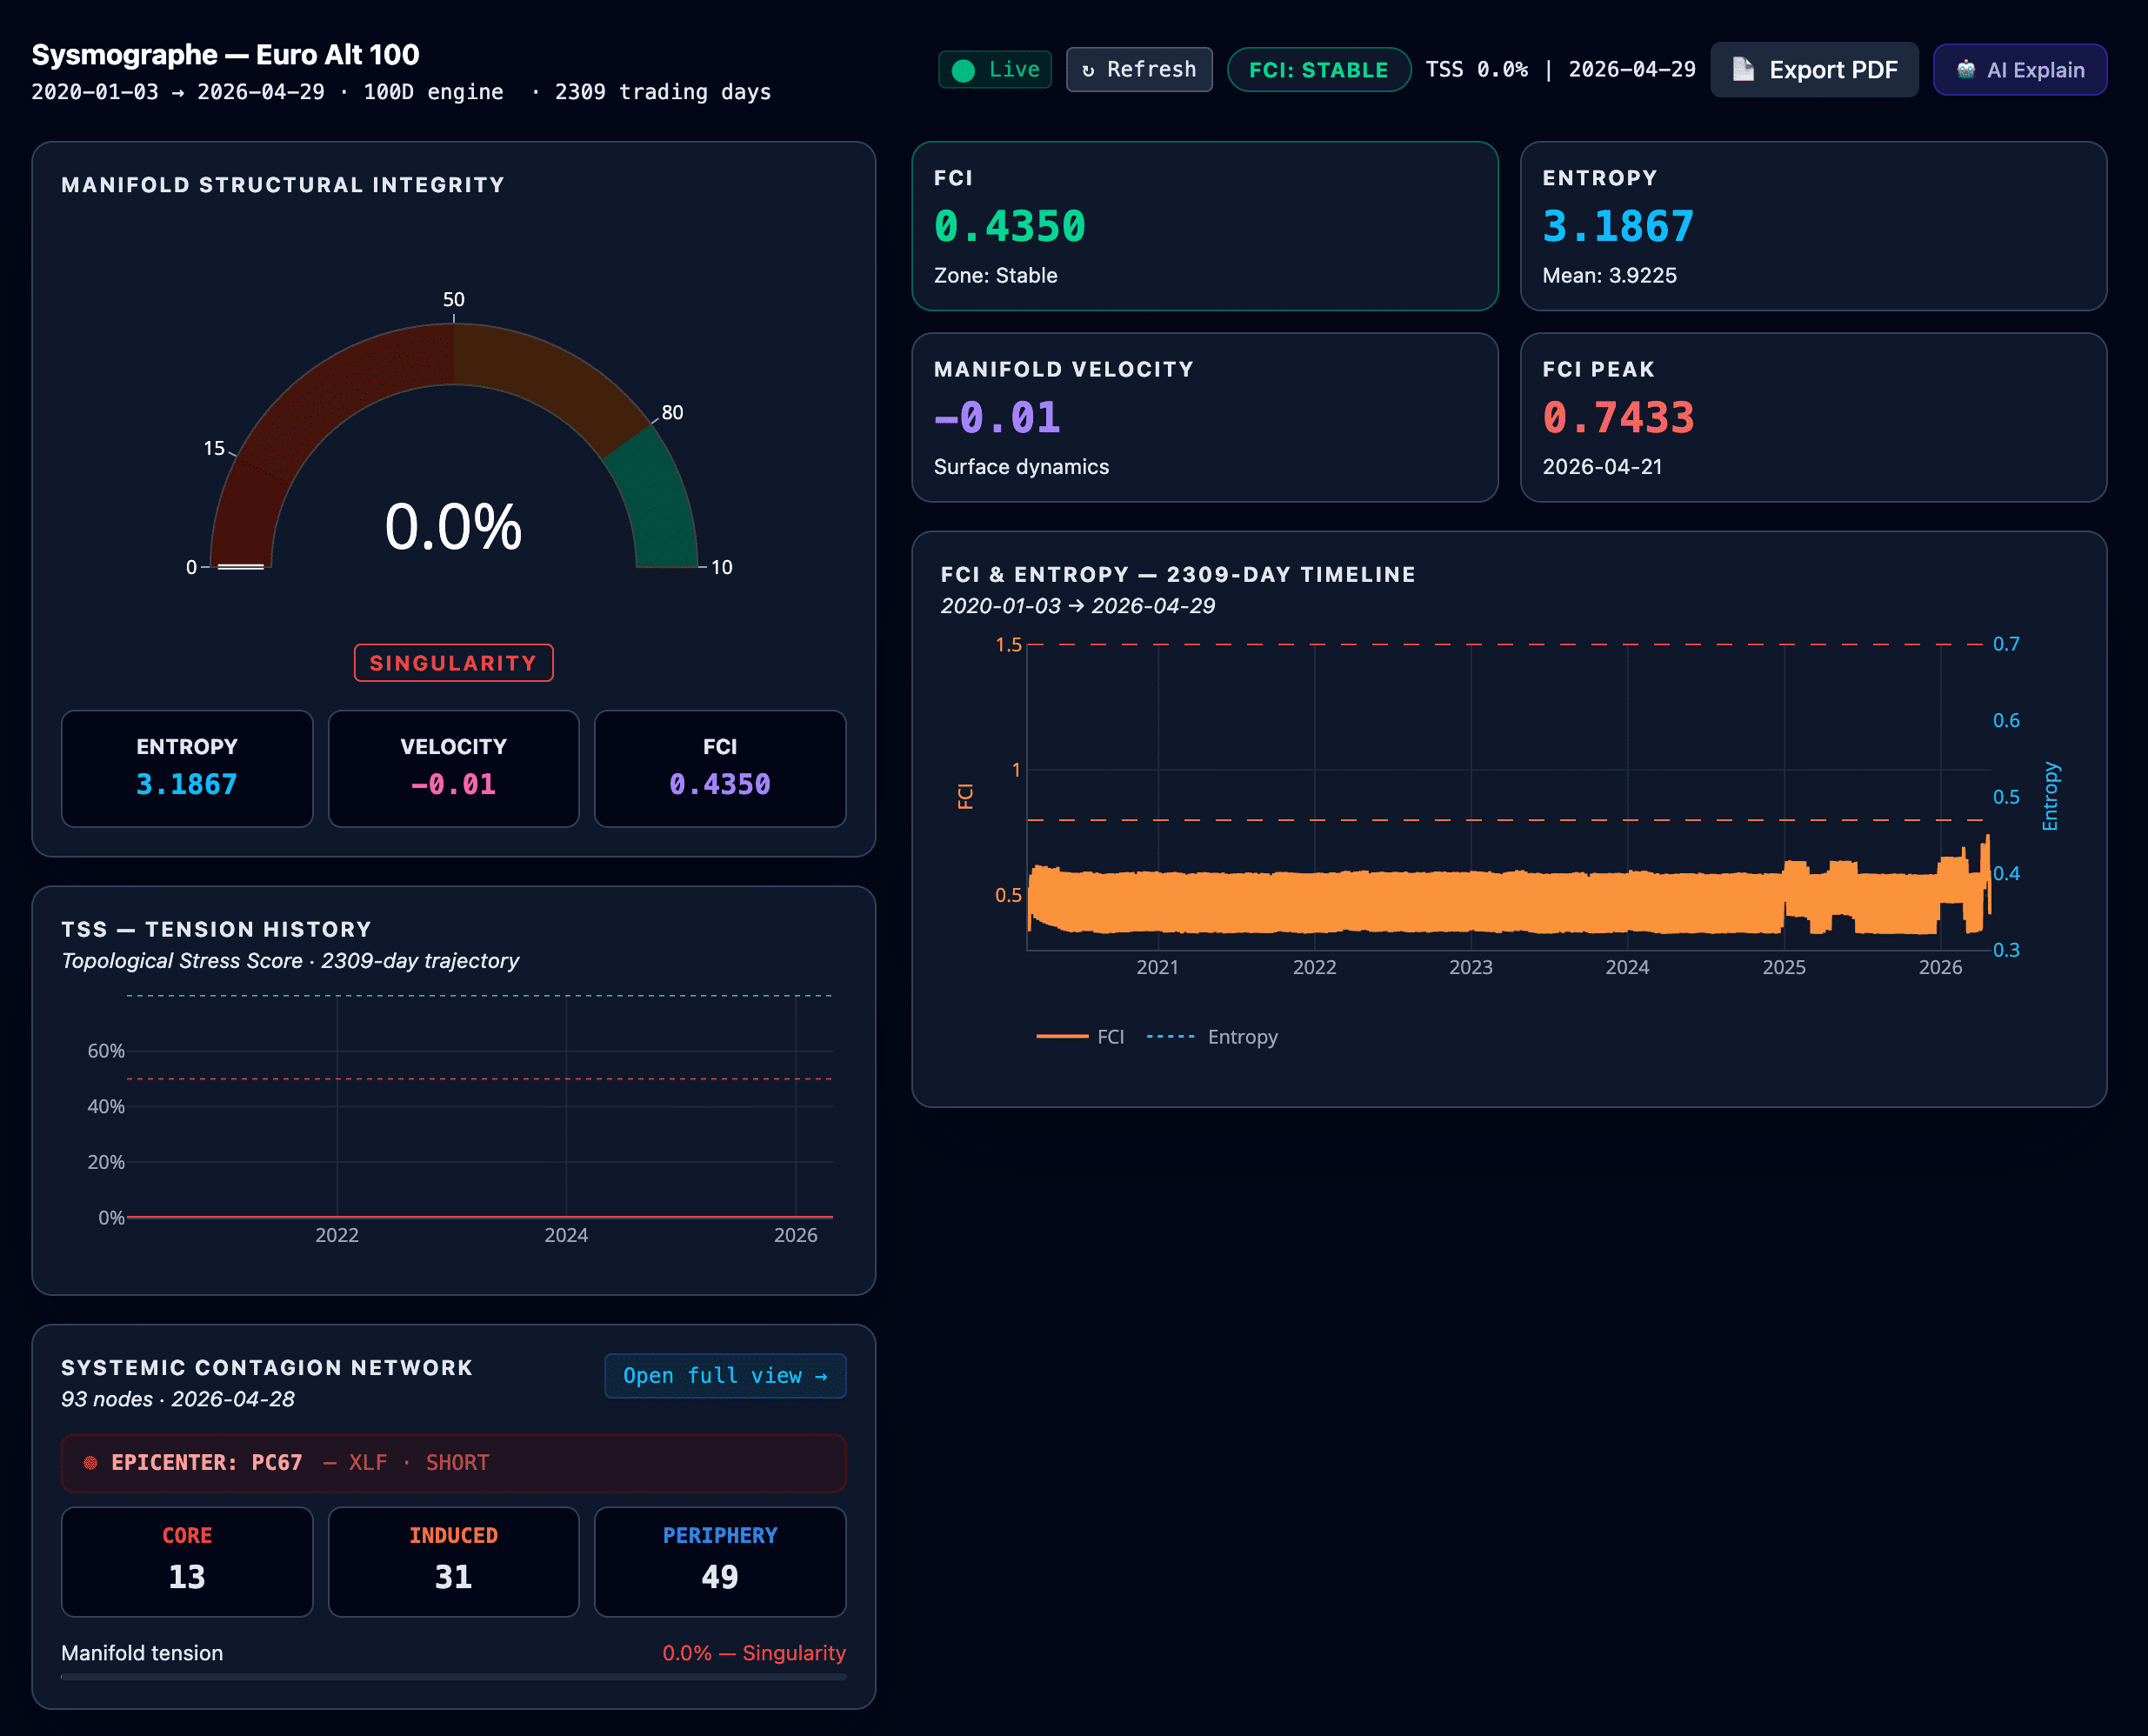
| Euro Alt 100 | 100D | 0.0% | Singularity | 0.45 | −0.01 | — | 0.89 (2025-02) | ISP/MI · SHORT |
Three things stand out.
First, the TSS scores are not comparable in level — but they are revealing in their relative ordering. A 9.3% TSS on a 77-dimensional macro manifold and a 54.2% TSS on a 13-dimensional sector manifold are reading two different geometries. The macro is not “five times more stressed than the S&P.” It is stressed by something the S&P does not see — namely the rates and FX components that dominate the Macro 77D space and are absent from the S&P sectoral manifold.
Second, the velocities tell a leading story. The S&P 500 (+0.03) and the Macro (+0.04) are stable or marginally improving. The Euro Stoxx 600 (−0.02) and the Euro Alt 100 (−0.01) are still degrading. Velocity, not level, is the early warning signal — it tells you not where you are, but where you are going.
Third, the FCI peaks anchor the narrative chronology. The S&P 500 and Macro peaks date to 2020 (COVID shock and its summer wave). Euro Stoxx 600 peaks in March 2022 (Russian invasion of Ukraine). And Euro Alt 100 peaks in February 2025 — the most recent of the four, and the only one of this decade unconnected to a global geopolitical event.
Something happened to European alternatives in February 2025 that did not happen to anyone else. And whatever happened, the manifold has not recovered since.
3. Why S&P 500 at 54% Tension Coexists with Macro at 9% Singularity
This is the question every sceptical reader will ask first, so let us settle it before going further.
The S&P 500 manifold reads 54.2% TSS — Tension regime. The Macro 77D manifold reads 9.3% TSS — Singularity. These two readings are mathematically consistent because they are computed on different SPD matrices over different asset universes.
The S&P 500 manifold contains 11 US equity sectors plus oil and gold. Their pairwise correlations evolve in a relatively constrained band — equities of large US firms tend to share macro drivers, and the sectoral covariance does not undergo dramatic restructuring outside of crisis periods.
The Macro 77D manifold mixes 11 US sectors, 15 country and regional equity ETFs, 12 spot currency pairs, 10 short-rate proxies, 6 commodity and stress assets, 8 CPI inflation indices, and 11 macroeconomic indicator proxies. Its covariance reflects the simultaneous behaviour of fundamentally different asset classes — equities behave like equities, currencies behave like currencies, rates behave like rates, and the cross-correlations between these classes carry far more information about systemic regime than any single class in isolation.
When rates and FX undergo regime change — as they have under the post-2022 monetary tightening cycle — the Macro 77D covariance restructures dramatically while the S&P 500 covariance does not. The 9.3% TSS is the geometric fingerprint of a rates-and-FX-driven systemic state. It is not a verdict on the S&P 500.
The contagion network confirms this. The Macro 77D contagion epicentre is TLT (long-duration US Treasuries) and GBPJPY (a sterling-yen FX cross historically used as a global liquidity gauge). Neither of these assets is in the S&P 500 manifold. The Macro singularity is real, but it is geographically and structurally elsewhere.
This is not a contradiction. It is the fundamental advantage of multi-manifold reading: each universe shows you where its specific fragility lives. The same underlying crisis can manifest as Tension in one space and Singularity in another, depending on where the manifold is most exposed to the source of stress.
The lesson for institutional allocators: a healthy equity dashboard does not mean a healthy portfolio. It means a healthy slice of the portfolio measured against itself.
4. Anatomy of Fourteen Months in Singularity
Now we come to the real subject of this article: the Euro Alt 100.
The Euro Alt 100 manifold tracks one hundred European alternative-economy proxies — mid-cap equities, financial sector stocks beyond the large-cap banking giants, real-estate vehicles, mid-tier industrial groups, and the secondary listings that aggregate the European non-large-cap economy. It is the geometric image of the part of Europe that does not fit on the front page of the FT.
For the first three years of its history (2020-2024), this manifold behaved as expected: tension during COVID, recovery, mild stress during the 2022 energy and Ukraine shock, and a return to a working baseline by mid-2024.
Then in February 2025, something broke. The FCI peaked at 0.89 on 10 February 2025, and the TSS collapsed toward zero. It has not recovered since. Today, fourteen months later:
- TSS = 0.0%: the manifold has no remaining structural integrity. There is no preferred direction of variance, no dominant factor, no recoverable geometric organisation. It is a flat space without orientation.
- Velocity = −0.01: the geometry is still degrading, slowly. Not enough to be called a fall, but not zero. The system is losing what little remaining structure it has, asymptotically.
- Entropy = 3.20 (vs mean 3.92): below baseline. The diversity of the manifold has collapsed into concentration. A small number of factors dominate, and the rest of the universe has become a noise background.
- Contagion epicentre = PC77, mapped to Intesa Sanpaolo (Milan listing) on the SHORT side: the systemic stress vector is identified with an Italian banking proxy held short. Not the bank itself failing, but the shorting of the bank acting as the dominant market signal.
This is not the geometric profile of a crash. It is the profile of an atrophy. The system did not fall — it stopped functioning.
The macro context: February 2025 and the end of the soft-landing illusion
What happened in February 2025 to set off this regime?
It is now visible in retrospect that early 2025 marked a psychological and technical rupture for European alternative-asset investors. Three things converged.
The ECB pivot stalled. Markets had to absorb the realisation that the deposit rate would stabilise in a neutrality band of approximately 1.75% to 2.25%, after the rapid 2024 cuts. The hope of a return to zero rates evaporated. For European alternatives, this meant the end of the mechanical revaluation through declining discount rates. From that point forward, valuations would have to be justified by operational growth — which proved very difficult to deliver in a low-growth European environment.
The mid-cap refinancing wall arrived. February 2025 was the moment when the reality of refinancing the debts contracted during the 2020-2022 cycle hit the market. European mid-caps — unlike the S&P 500 giants who have access to deep public bond markets — found themselves trapped. Banks, including Intesa Sanpaolo and its peers, tightened lending conditions, not from a lack of liquidity but from prudential caution faced with deteriorating SME and ETI margins.
The banking sector turned cautious on alternatives. Although European banks themselves posted decent results, the lending posture toward non-listed assets and alternative vehicles hardened in early 2025. Focus shifted to non-performing loan management. Intesa Sanpaolo became, in this context, a perfect symbol — a bank that was performing well, but whose lending behaviour was draining the vital flow toward the alternative segment.
The convergence of these three forces broke the financing loop on which the European alternative economy depended. And the manifold — measuring the covariance structure of these assets, not just their prices — captured the rupture immediately.
Atrophy versus crash: the geometric difference
In Universe Risk Framework terminology, there is a fundamental distinction between an active crisis and an established singularity.
An active crisis is characterised by high TSS volatility, large positive or negative velocity, sharp FCI peaks, and a dynamic contagion network. Markets are in violent reorganisation. The 2008 financial crisis, the 2020 COVID shock, and the 2022 energy crisis all produced active-crisis signatures across multiple manifolds.
An established singularity is different. TSS is at or near zero, velocity is small and oscillating around zero (sometimes slightly negative, sometimes slightly positive), the FCI no longer makes new peaks, and the contagion network is concentrated and stable. The system is not falling. It is also not recovering. It is in a degraded stationary state — a geometric configuration that has lost most of its structure but does not have enough internal energy to either rebuild or to collapse further.
We can call this geometric zombification. It is the structural counterpart of what credit analysts have long called the zombification of European mid-cap balance sheets — corporates kept alive by accommodative credit but unable to generate the operating returns required to grow, refinance, or be acquired at fair value. The manifold expresses this zombification not as a price collapse but as the evaporation of geometric structure.
The Euro Alt 100 has been in this state for fourteen months. It is not drifting back. The velocity is slightly negative, suggesting the slow exit of remaining structure rather than the slow rebuilding of new structure.
Velocity as the leading indicator
A risk manager familiar with traditional metrics — Population Stability Index, value-at-risk, expected shortfall — will note that none of these metrics raised alarms on the Euro Alt 100 in early 2025 the way the manifold did. They could not. They are designed to detect movement, and movement was not what was happening. What was happening was the disappearance of structure, which is invisible to metrics that operate on marginal distributions.
The manifold velocity is the metric that captures this. When velocity goes negative and TSS goes flat, the manifold is contracting toward a singularity — losing structure, not gaining stress. This is the geometric early warning that traditional risk management lacks.
The Euro Stoxx 600 velocity is also negative (−0.02), at a higher TSS level (27.9%). This suggests that the European large-cap manifold is on the same trajectory as the alts but earlier in the process. Whether it will reach the same singularity-with-zombification state of the alts is an open question — but the geometric direction of travel is the same.
5. The Map of Four Epicentres
When four parallel manifolds all show stress but in different regimes, the most powerful diagnostic is the contagion epicentre map. Each manifold’s contagion network identifies the specific assets driving the systemic stress within that universe. The four epicentres of our four universes form a map of where the global crisis lives, viewed from four different angles.
| Universe | Epicentre | Stress signature |
|---|---|---|
| Macro 77D | TLT + GBPJPY | Long-duration rates + global FX liquidity gauge |
| S&P 500 | XLE + USO + GLD | Energy and precious metals |
| Euro Stoxx 600 | FCC + Construction | European cyclicals and infrastructure |
| Euro Alt 100 | ISP/MI · SHORT | Italian banking proxy held short |
This is not noise. It is a coherent picture.
The macro singularity is a rates and FX phenomenon. The world’s monetary architecture is in a state of geometric stress that has not resolved since the post-2020 inflation-then-tightening cycle. TLT (long Treasuries) carries the weight of the duration mispricing. GBPJPY carries the weight of cross-border carry-trade fragility. Together, these two assets define the macro epicentre.
The S&P 500 stress, as we saw, lives in energy and commodities. XLE, USO, and GLD form a triangle of stress emission. The defensive sectors (XLP, XLU, XLV, XLRE) are induced by this stress — they are the rate-sensitive and inflation-sensitive transmission channels. And — critically — the dominant US equity sectors (XLK Tech, XLF Finance, XLY Discretionary) sit in the periphery, decoupled. This is why the S&P 500 index can keep climbing while the manifold reads Tension: the sectors driving the index are insulated from the sectors driving the geometry.
The Euro Stoxx 600 stress lives in construction and cyclical industrials, with broader index proxies as transmission. This is the European real-economy fragility — the part of Europe most exposed to growth disappointment, stagnant infrastructure budgets, and the consequences of the energy transition without sufficient capital.
And the Euro Alt 100 stress lives, as we have seen, in the Italian banking shorting signal. Not in a bank’s failure, but in the market’s persistent positioning against banks as a proxy for the non-listed and mid-cap financing chain.
Four epicentres. One coherent crisis. The same underlying tightening of global liquidity, monetary normalisation, and credit selectivity expresses itself differently in each manifold according to the local geometry. Same crisis. Different addresses.
This is a perspective that no single index, no single dashboard, and no single risk metric can deliver. It requires reading multiple manifolds in parallel and treating their differences as information, not contradictions.
6. What This Means for Your Allocation
The four-manifold reading has direct operational implications for institutional investors.
For chief investment officers and asset allocators. The most consequential observation is that the Euro Alt 100 has not recovered for fourteen months and shows no geometric sign of recovery. Allocations to European mid-cap equities, European private debt, European real estate vehicles, and European mid-tier private equity should be re-examined on a regime basis, not a price basis. The price marks may move, but the underlying geometric structure of the segment is not regenerating. If your allocation thesis depends on a mean-reversion to pre-2025 conditions, the manifold suggests that thesis is fragile.
For risk managers and CRO functions. The Euro Stoxx 600 velocity is negative at TSS 27.9%. This is the trajectory we observed on the Euro Alt 100 in late 2024 — a manifold transitioning from Tension into Singularity. The institutional risk implication is that European large caps may be on the path to the same regime as European alts, and conventional VaR-based risk metrics will not capture this until it is well advanced. Velocity-based monitoring on the Euro Stoxx 600 is the operationally relevant metric for the next 12-18 months.
For institutions exposed to IFRS 9 forward-looking provisioning. Geometric singularity in a credit-relevant universe is a leading indicator of forward credit deterioration. The Euro Alt 100 epicentre on Intesa Sanpaolo SHORT is a market-priced signal of expected credit pressure on the Italian mid-cap borrower segment. Integrating manifold-based regime indicators alongside conventional PSI and migration-matrix monitoring can extend the IFRS 9 forward horizon by several quarters, materially improving provision adequacy under Stage 2 reclassification.
For multi-asset portfolios. The fact that the S&P 500 manifold reads Tension while the Euro Alt 100 reads zero-Singularity is not a regional spread trade. It is a regime arbitrage. The geometric divergence between the two manifolds has structural drivers (rates, ECB stance, mid-cap refinancing, banking lending posture) that will not reverse on a tactical timescale. Position sizing and hedge construction should reflect this regime asymmetry.
7. Conclusion
Markets remain caught in a comforting illusion. The S&P 500 is climbing. Indices in Europe are flat. Macro variables are mixed but not catastrophic. The dashboards are green or amber, rarely red.
But regime is not the same thing as level. Geometric singularity is a state in which the structural integrity of an asset universe has broken down. It does not require prices to be falling. It does not require defaults to be spiking. It only requires that the covariance structure has flattened into a degraded stationary state from which the manifold can no longer reorganise itself.
The Euro Alt 100 has been in this state for fourteen months. The Euro Stoxx 600 is on the same trajectory. The macro manifold has been broken for years and is stable in its broken state. Only the S&P 500 — and only by virtue of its dominant tech-and-finance sectors being decoupled from the energy-and-commodity epicentre — remains in tension rather than singularity.
The next institutional crisis in Europe will not announce itself as a crash. It will continue to manifest as silence — atrophy, zombification, the disappearance of structure where structure used to live. The alternative-economy segment is already there. The large-cap segment is following.
The advantage of reading four manifolds in parallel is that you see this happening before the price tape tells you. The advantage of reading geometry rather than levels is that you can act when there is still optionality.
Disclaimer: This analysis is for research purposes only and does not constitute investment advice, a solicitation to buy or sell
securities, or an opinion on the financial soundness of any specific issuer. Mentions of individual securities are illustrative of geometric
signals observed in market data and reflect publicly observable contagion network outputs of the Sysmograph methodology. The Sysmograph reading is not a forecast.
Want this perspective on your own portfolio?
We provide bespoke Sysmograph readings and Universe Risk Framework analyses for institutional investors, asset allocators, and pension funds. A typical engagement covers your specific portfolio universes, regime detection on your alternative allocations, and integration with your existing risk-management framework.
If you would like to explore a structured proof of concept on your own portfolio:
- Institutions and asset managers: Request a confidential POC at contact@econosysmographe.com
- Pension funds and consultants: Schedule a 30-minute briefing on Sysmograph reading for long-horizon allocations
- Research papers and methodology: SSRN author page
Econosysmographe™ is a Universe Risk Framework analytics platform. The Sysmograph reading is published periodically and is not investment advice.
© 2026 Econosysmographe™ — Universal Risk Framework Methodology · Trident-AI Engine v3.0 · Papadopoulos Distance Mode · 77-Dimensional Geometric Analysis