
In today’s volatile markets, identifying reliable Systemic Risk Signals is the holy grail of portfolio protection. While most investors rely on the VIX, a more advanced approach using the Universe Risk Framework (URF) provides earlier warnings.”
Analyzing Systemic Risk Signals through Geometry
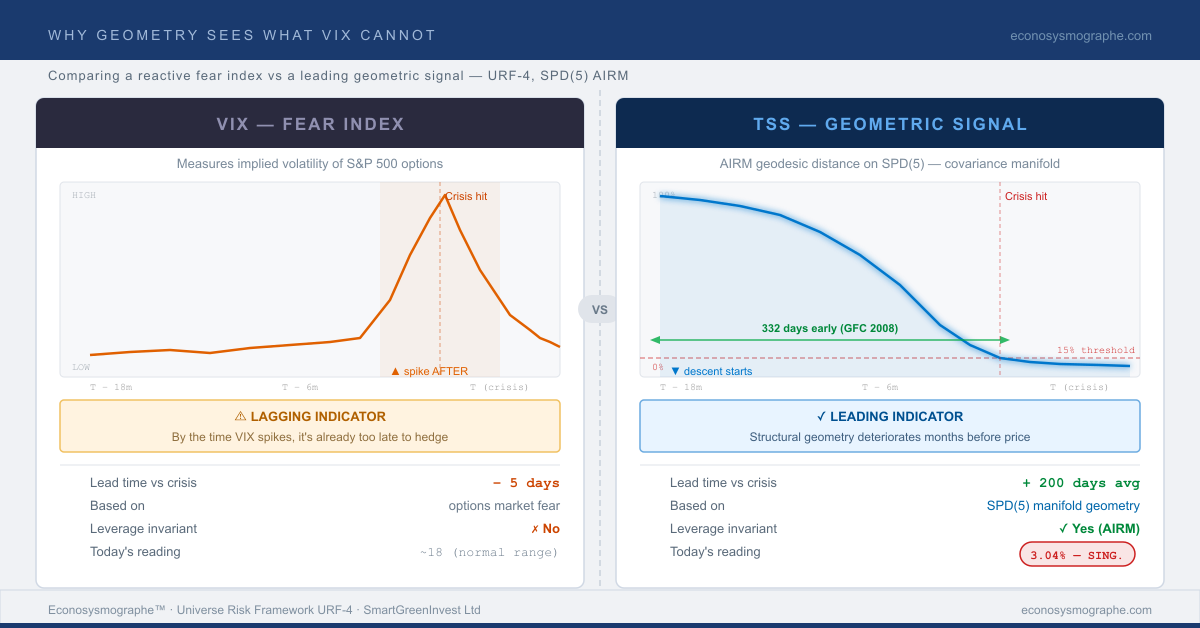
To detect structural fragility, we must look deeper into the geometry of covariance matrices. This is where the Topological Survival Score (TSS) provides a decisive advantage.
The Science: Reactive vs. Predictive
The TSS doesn’t measure price movement; it measures the spectral concentration of risk on the SPD(5) manifold (the space of Symmetric Positive Definite matrices).
- The VIX: A reflection of implied volatility. It’s a mirror in the rearview mirror.
- The TSS: A measure of structural manifold curvature. It identifies “Minsky singularities” months before they manifest in price action.
The Mathematical Foundation
$$TSS = \frac{G_{mean}}{A_{mean}} \times 100\%$$
When the TSS moves toward 0%, it signifies that all eigenvalues are concentrating on a single dimension. In this state, market diversity collapses. Diversification fails exactly when you need it most because the system has lost its topological resilience.
Current Reading: 3.04%
Our current reading of 3.04% is a critical signal. For context, this same metric reached similar levels 332 days before the 2008 collapse. While the VIX may remain calm today, the underlying manifold geometry is signalling a significant structural shift.
Resources & Further Reading
- Whitepaper: The URF-4 technical paper is available on SSRN for a deep dive into Riemannian geometry applied to finance.
Institutional Access
We are currently opening 10 exclusive spots for our Institutional Early Adopter Program. Get real-time access to the TSS dashboard and weekly systemic risk intelligence. Apply for Early Access Here