
A 6-minute read for boards, CROs and CFOs. Most institutional risk models assume the space they measure is flat. A single, reproducible measurement says it is curved by about a quarter — and more in a crisis. Archegos shows the cost of a risk seen and not acted on. This is about the one your metric never shows you — and why that is now a board-level question.
Special Edition · Econosysmographe™ · Not financial or legal advice
30-second brief — self-contained
- The incident — in March 2021 Credit Suisse lost ~USD 5.5bn to Archegos on a position its risk systems had measured and approved.
- The cause — standard risk metrics (VaR, Frobenius) assume a flat correlation space. A reproducible measurement shows finance is curved by ~26% — and ~29% in stress.
- The consequence — flat metrics understate true risk — on the order of a fifth on a diversified book, more in stress and far more on a concentrated one — always in the same direction; under prudential duty (prudent-person / SR 11-7 / TRIM) that unexamined assumption is now a board-level question.
- The answer — the Curvature Audit measures your own book’s blind spot — one defensible page for your model-risk committee.
Apply the Curvature Audit to your own book.
Book a free 1-hour Discovery Session with our CEO →
60-minute conversation · No commitment · For institutional risk officers and CIOs.
Five and a half billion dollars, measured and approved
In March 2021, Credit Suisse lost about USD 5.5 billion in a matter of days to the collapse of a single family office, Archegos Capital Management. Across the prime-brokerage industry the total exceeded USD 10 billion.
The board’s own investigation is unsparing — but its verdict is not the one you might expect. It did not find that the risk systems were blind. The opposite: it concluded this was not a case where “the existing risk systems failed to operate sufficiently to identify critical risks.” The exposure was concentrated, correlated, and visible. What failed was the organisation around the number — a “failure to effectively manage risk,” a “lack of risk escalation,” limit breaches left uncontrolled. The risk was seen. It was not acted on. Two years later — after Archegos, and a second scandal at Greensill — Credit Suisse itself was gone: a 167-year-old, globally systemic bank, absorbed by a rival over a single weekend. Too big to fail did not save it.
That is one way an institution is undone: the metric works, and the governance does not. This article is about the other way — quieter, more universal, and present even when governance works flawlessly: when the metric itself understates the risk it is measuring. That failure is not behavioural. It is geometric — and almost every institutional risk model has it built in, including, very probably, yours.
A blind spot with a long history
This is not new. By the late 1980s, Finland looked like a model economy. Financial deregulation had opened the gates to foreign credit, an asset-price boom followed, and favourable fundamentals justified the optimism — the fixed exchange rate even fostered an illusion of low currency risk. Then it broke. Output fell by some 13% between 1990 and 1993, unemployment leapt from 3% to 18%, the banking system needed a state rescue as credit losses reached 15% of GDP, and the markka was forced off its peg. Finland was not a black swan. It was a system whose conventional measures and policy consensus stayed confident — and radically underestimated the fragility building underneath — until the collapse surprised even the policymakers. That is the family of failure this article is about: not fraud, not a missing control, but a danger the standard read is not built to register.
The assumption no one on your committee validated
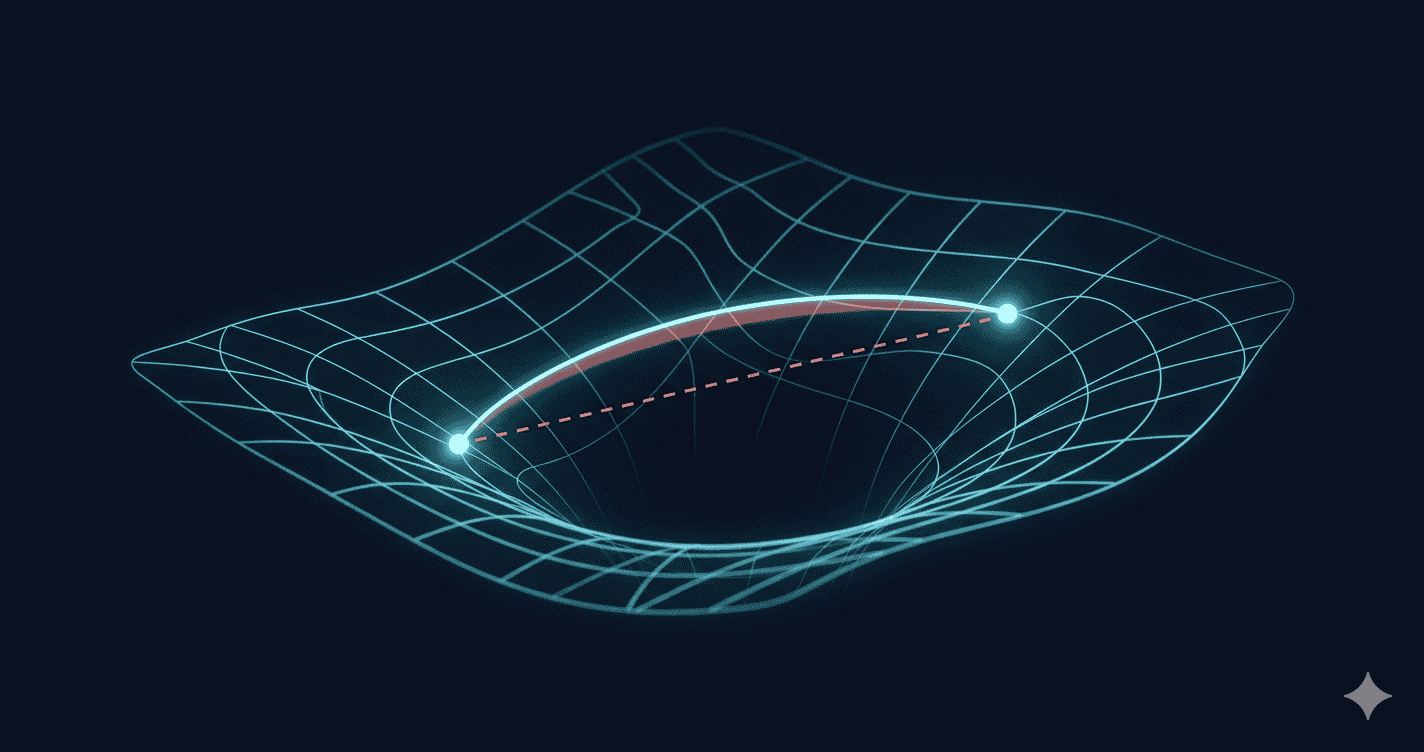
Almost every market-risk number a financial institution produces — Value-at-Risk, stress aggregation, risk-parity weights, correlation overlays — rests on one quiet assumption. The cross-asset correlation matrix is treated as if it lives in flat, Euclidean space: distances between two correlation states are measured with the ordinary (Frobenius) metric, as though the matrix were just a long list of numbers on a flat grid.
That is an assumption. It is rarely written down, almost never tested, and it propagates into every downstream figure. If the space is in fact not flat, every distance computed on it is a chord across a curve — systematically too short. Your risk number would understate the real distance to stress, and you would not know by how much.
How Eratosthenes settled “flat or curved” in 240 BC
There is a clean way to test whether a space is flat: measure it. In 240 BC, Eratosthenes compared the angle of the midday sun’s shadow at two cities. A flat Earth predicts no difference. He measured about 7.2 degrees — and that non-zero gap was the curvature. Converting the angle into a distance, he estimated the Earth’s circumference to within about 2 percent. One measurement, no satellites, settled the question.
The financial version is just as direct. Take a correlation trajectory and measure its step-to-step distance two ways: once with the flat (Frobenius) metric, once with the true geodesic distance on the curved space of correlation matrices. Their relative gap — the curvature signature — is the financial shadow angle. It is zero if the space is genuinely flat, strictly positive if it is curved. No parameters, no model choices, and a clean null hypothesis: flat, or not.
The verdict: finance is curved by about a quarter — more in a crisis
Measured across three decades of global markets — eleven equity indices, 1995 to 2026 — the flat-world null is rejected overwhelmingly: the space is not flat, and it is not close to flat. The curvature also tightens as liquidity tightens.
| Regime | Curvature signature |
|---|---|
| Calm / abundant liquidity | ~ +23% |
| Stressed / high volatility | ~ +29% |
| Full sample 1995–2026 | ~ +26% |
Translate that into the board’s language. An institution measuring risk distance with the flat metric is reading the chord of a curved geodesic. A curvature signature of about +26% means the flat ruler recovers roughly four-fifths of the true risk distance and misses on the order of a fifth — and the miss widens in the stressed regimes, where the signature rises toward +29%. Exactly when accuracy matters most — the Finland quarter, the moment the dashboard stays green — the flat metric understates risk by the most.
One further finding matters for concentration risk: the more concentrated and correlated a book, the larger its curvature — so a tightly concentrated book understates its risk by considerably more than a diversified one. The flat ruler fails worst exactly where exposure is most concentrated — the very profile, incidentally, that Archegos presented to its prime brokers.
This is not a stylistic preference between two modelling schools. It is a measurement. The data say the curved metric is the one that fits, and the flat one leaves risk on the table in a direction that is always the same: understatement.
Why this is now a governance question, not a quant one
Why this reaches the board → model-risk governance already makes the assumptions inside your models your responsibility — not your quants’.
Here is where it stops being an interesting result and becomes a board matter. The oldest principle in our profession is prudential: the duty to steward assets as a careful manager — the bon père de famille of the civil-law tradition, the prudent person of Solvency II. A prudent steward is expected to know whether the instruments they rely on understate the very risk they are paid to contain. Modern supervision only codifies that duty:
- SR 11-7 (the Federal Reserve and OCC guidance on model risk management) places accountability for understanding model assumptions and limitations with senior management and the board.
- TRIM (the ECB’s Targeted Review of Internal Models) sets the equivalent expectation in Europe.
- The prudent-person principle (Solvency II, pension frameworks) and the fiduciary duty asset managers owe their clients carry the same logic: you are expected to know what your tools assume and where they fail.
Archegos was not adjudicated as bad luck. It was adjudicated as a governance and risk-control failure. So the question is not whether your VaR is sophisticated. It is whether the flat-space assumption underneath it is a documented, governed choice — or an unexamined blind spot. “We did not know the metric systematically understated risk in stress” is, in our view, an increasingly difficult position for a board to hold, when the test that would have told you runs on public data.
What this gives a chief risk officer
The point is not to replace your risk function. It is to give it one number it does not currently have. Measuring your own curvature signature yields three operational properties:
- Measurability — a concrete figure for how much risk distance your current metric is missing, on your book, not a global average.
- Defensibility — a documented, governed answer for your model-risk committee: the flat-space assumption examined, quantified, and signed off rather than inherited silently.
- Stress-localisation — because the gap widens in stress, the measurement tells you where your blind spot is worst, which is exactly where a board most needs to know it exists.
The challenge
So we will put it plainly to the C-suite, as a question of prudential responsibility — not an accusation:
If your current models understate your risk by something like a fifth — and far more if your book is concentrated — and a black swan or a flash crash arrives next quarter, do your assets, and your firm, survive it?
A prudent steward asks that question before the event, not in the post-mortem. You cannot answer it from this article: the +26% is the global curvature. The number that decides your firm’s survival is your book’s — how much of your own true risk distance your own metric is missing, and how far that gap blows out in exactly the regimes that threaten you.
Get your book’s curvature signature.
Book a free 1-hour Discovery Session with our CEO →
A one-page read for your model-risk committee · 60-minute conversation about what it means.
The Eratosthenes test is independently reproducible on public market data; the result above does not depend on a black box. The Curvature Audit runs the same measurement on your portfolio and returns a single, defensible page: your curvature signature, your stress-regime widening, and what fraction of risk distance your current metric leaves uncounted. Evidence for the committee — not a performance pitch. From there we explore, with you, how to close the gap: documenting the assumption for your governance file, monitoring the signature over time, or extending the read across your full book.
What this measurement does not claim
This article does not claim that a curvature measurement predicts crises, replaces your risk function, or would by itself have stopped Archegos. It claims something narrower and defensible: the flat-space assumption beneath standard risk metrics is empirically wrong, the error is always in the direction of understatement, and it is largest in stress. In risk governance, the difference between an unexamined assumption and a measured, signed-off one is not cosmetic. It is the difference between inheriting a blind spot and bounding it.
A flat ruler on a curved world always reads short — and it reads shortest in a storm.
References and further reading
Incident & governance
- Credit Suisse Group AG — Report of the Special Committee of the Board of Directors on Archegos Capital Management (Paul, Weiss, 2021).
- Board of Governors of the Federal Reserve System & OCC — SR 11-7: Guidance on Model Risk Management (2011).
- European Central Bank — Targeted Review of Internal Models (TRIM): Guide to internal models (2021).
- Solvency II (Directive 2009/138/EC) — prudent-person principle.
- Jaakko Kiander (Labour Institute for Economic Research) — The Great Depression of Finland 1990–1993: causes and consequences (European Parliament, 2009). Figures: GDP −13% (mid-1990 to mid-1993), unemployment 3%→18%, bank credit losses ~15% of GDP.
Methodology
- Papadopoulos, E. (2024–2026). Universe Risk Framework — Papers 1–4. SSRN.
- Reproducible on public data — eleven global equity indices (S&P 500, NASDAQ Composite, NASDAQ-100, FTSE 100, DAX, CAC 40, Nikkei 225, Hang Seng, KOSPI, ASX 200, Bovespa), reduced to ten principal components, 63-day rolling correlation window, 1995–2026. The curvature signature is the relative gap between the affine-invariant (geodesic) and the Frobenius (flat) step distances.
For institutional access or a Curvature Audit discussion: contact@econosysmographe.eu · econosysmographe.com/institutional-access
Educational purpose only. Not financial, legal, or compliance advice. References to SR 11-7, TRIM, Solvency II and fiduciary standards are illustrative of the governance context and do not constitute a legal assessment of any firm’s obligations. The Archegos summary and Credit Suisse’s 2023 takeover reflect publicly reported facts and the bank’s own published review. SmartGreenInvest Ltd (Reg. England & Wales No. 14636473) is not an FCA-authorised firm.
By Evangelos Papadopoulos · Independent Researcher · econosysmographe.com